Custom Dashboards
In addition to our pre-built dashboards for topics like Crashes, Logs, and Network Requests, each project can create Custom Dashboards. In these dashboards, you can create new analyses. Visualize a time series of Crash data segmented by app-version, or get a ranking of Logs filtered by a specific property.
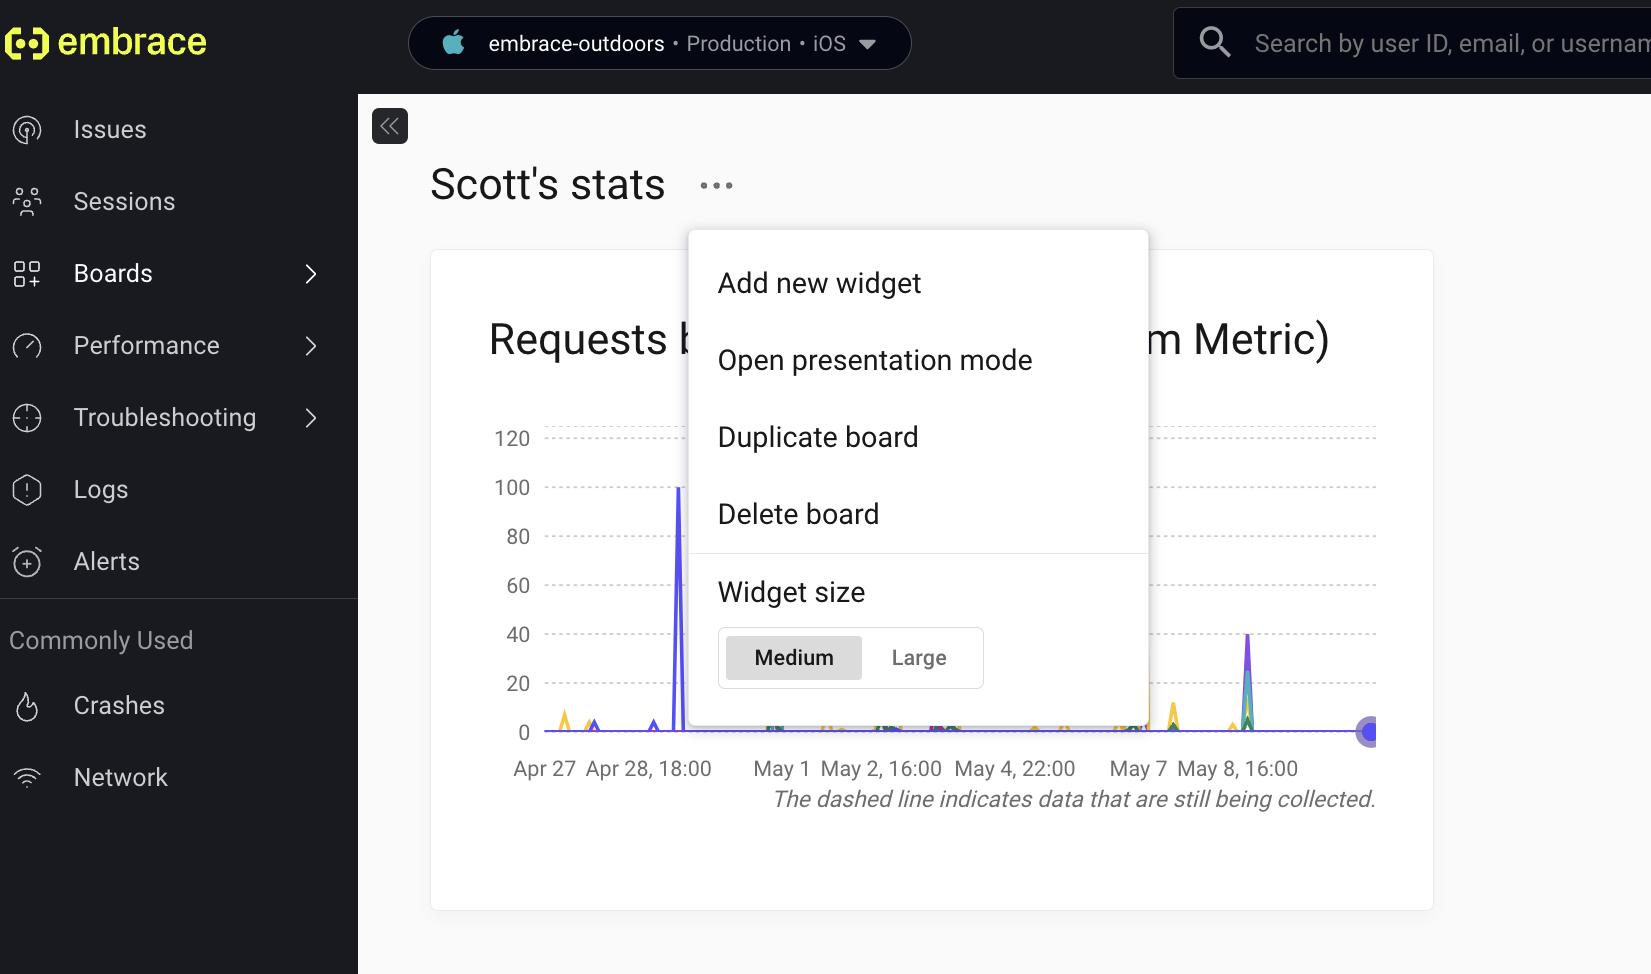
To get started, click on "Add new widget" in the menu by your dashboard name.
Spans (Traces)
Create graphs monitoring Spans performance. You can filter and group by name, outcome, duration, and any attributes you have set on the Span.
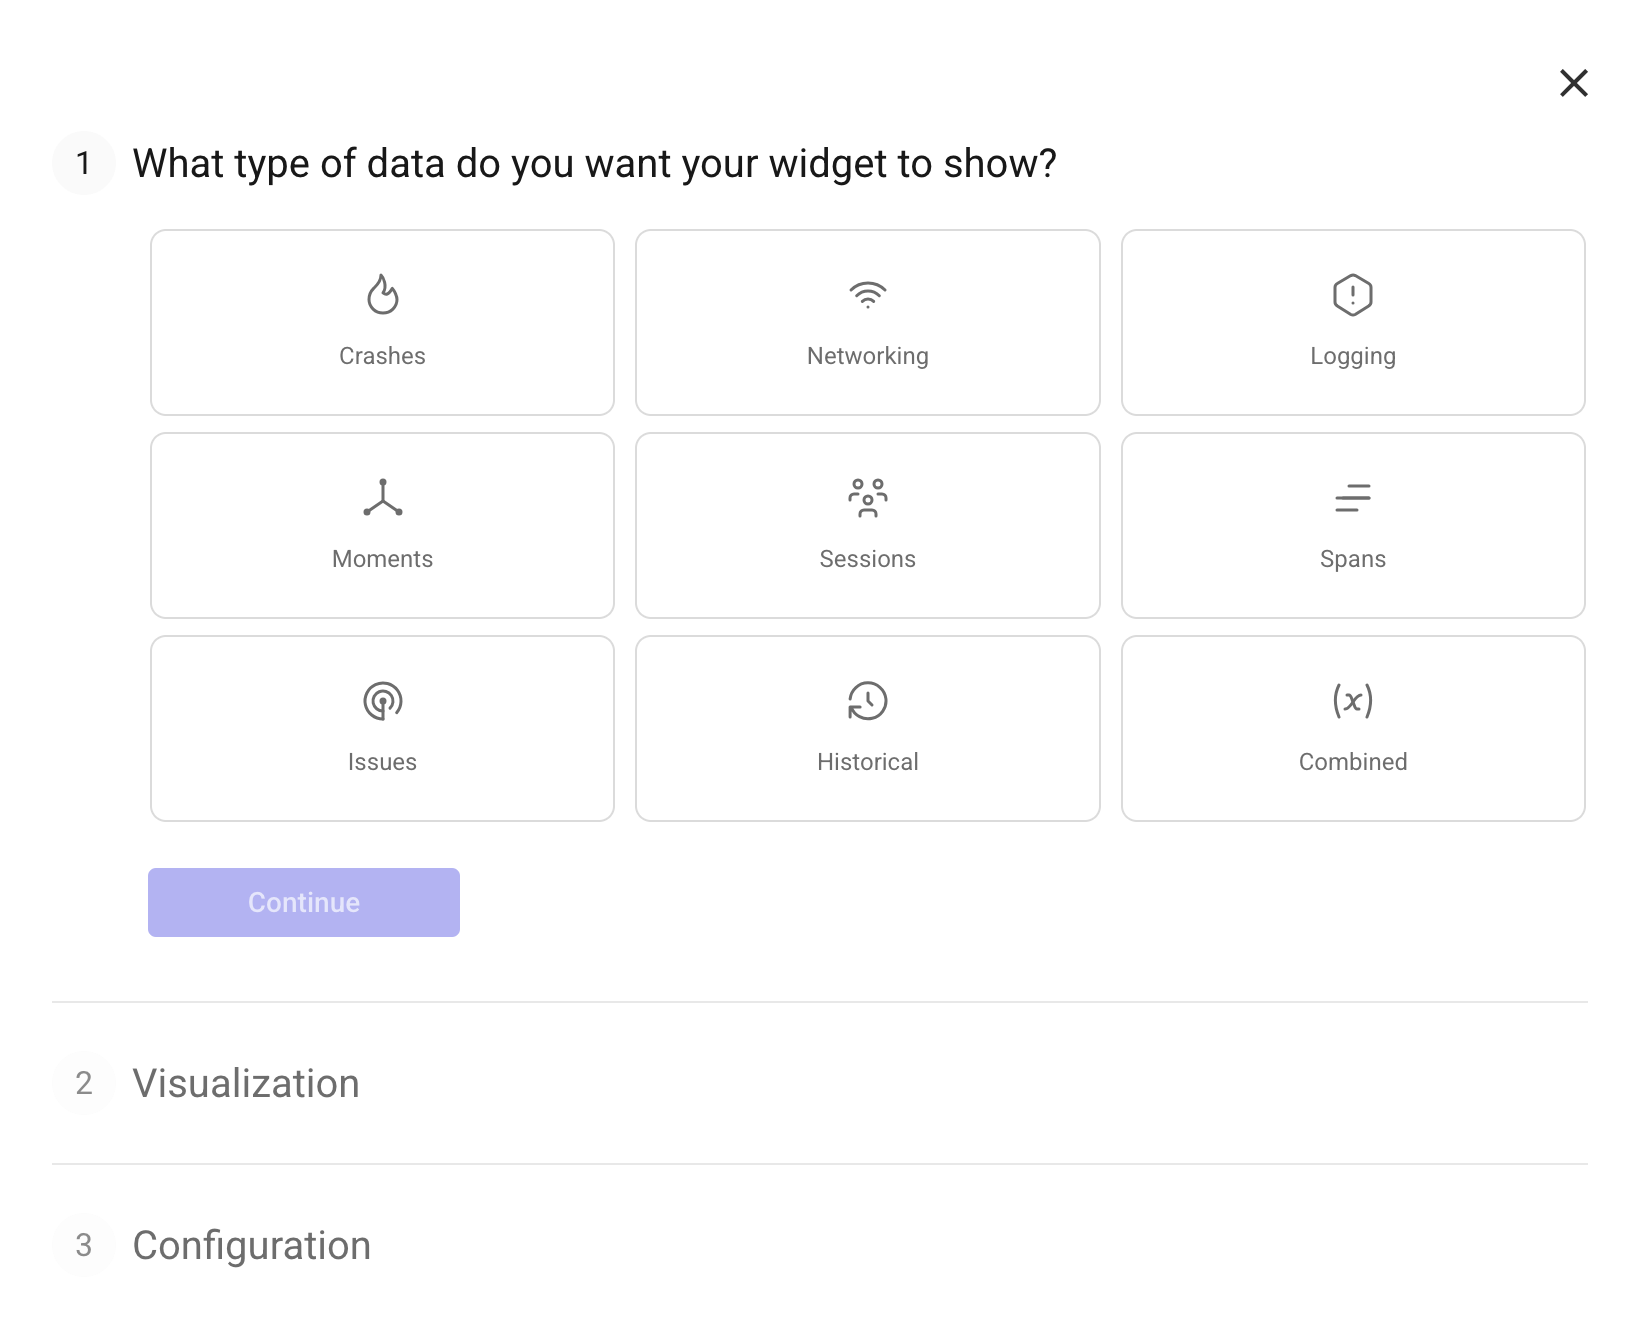
First, select the Spans category when making a new Widget:
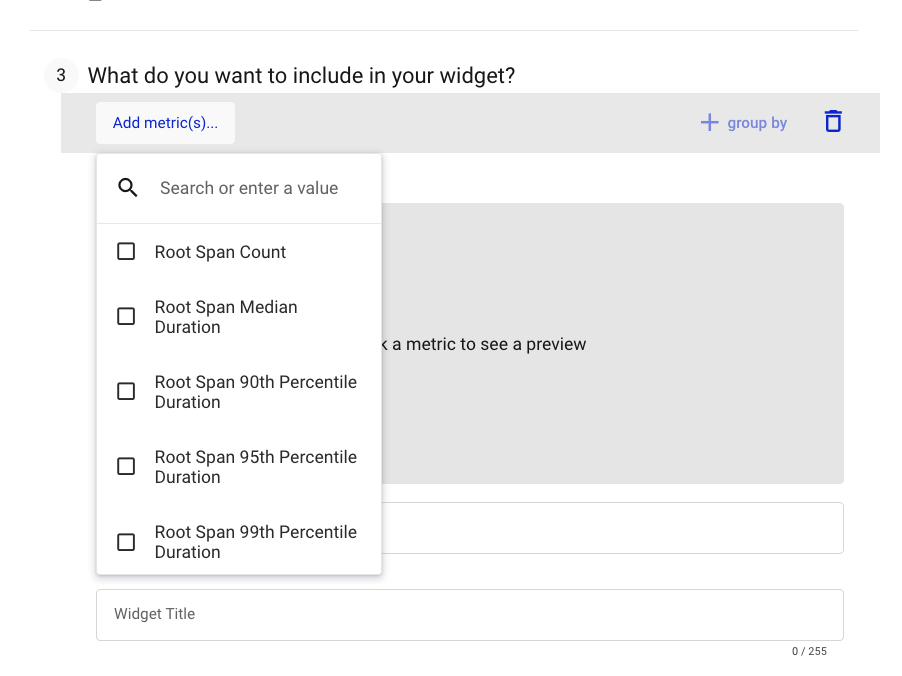
Then, choose the metric you wish to aggregate. For Spans, Embrace supports both counts and sums of duration.
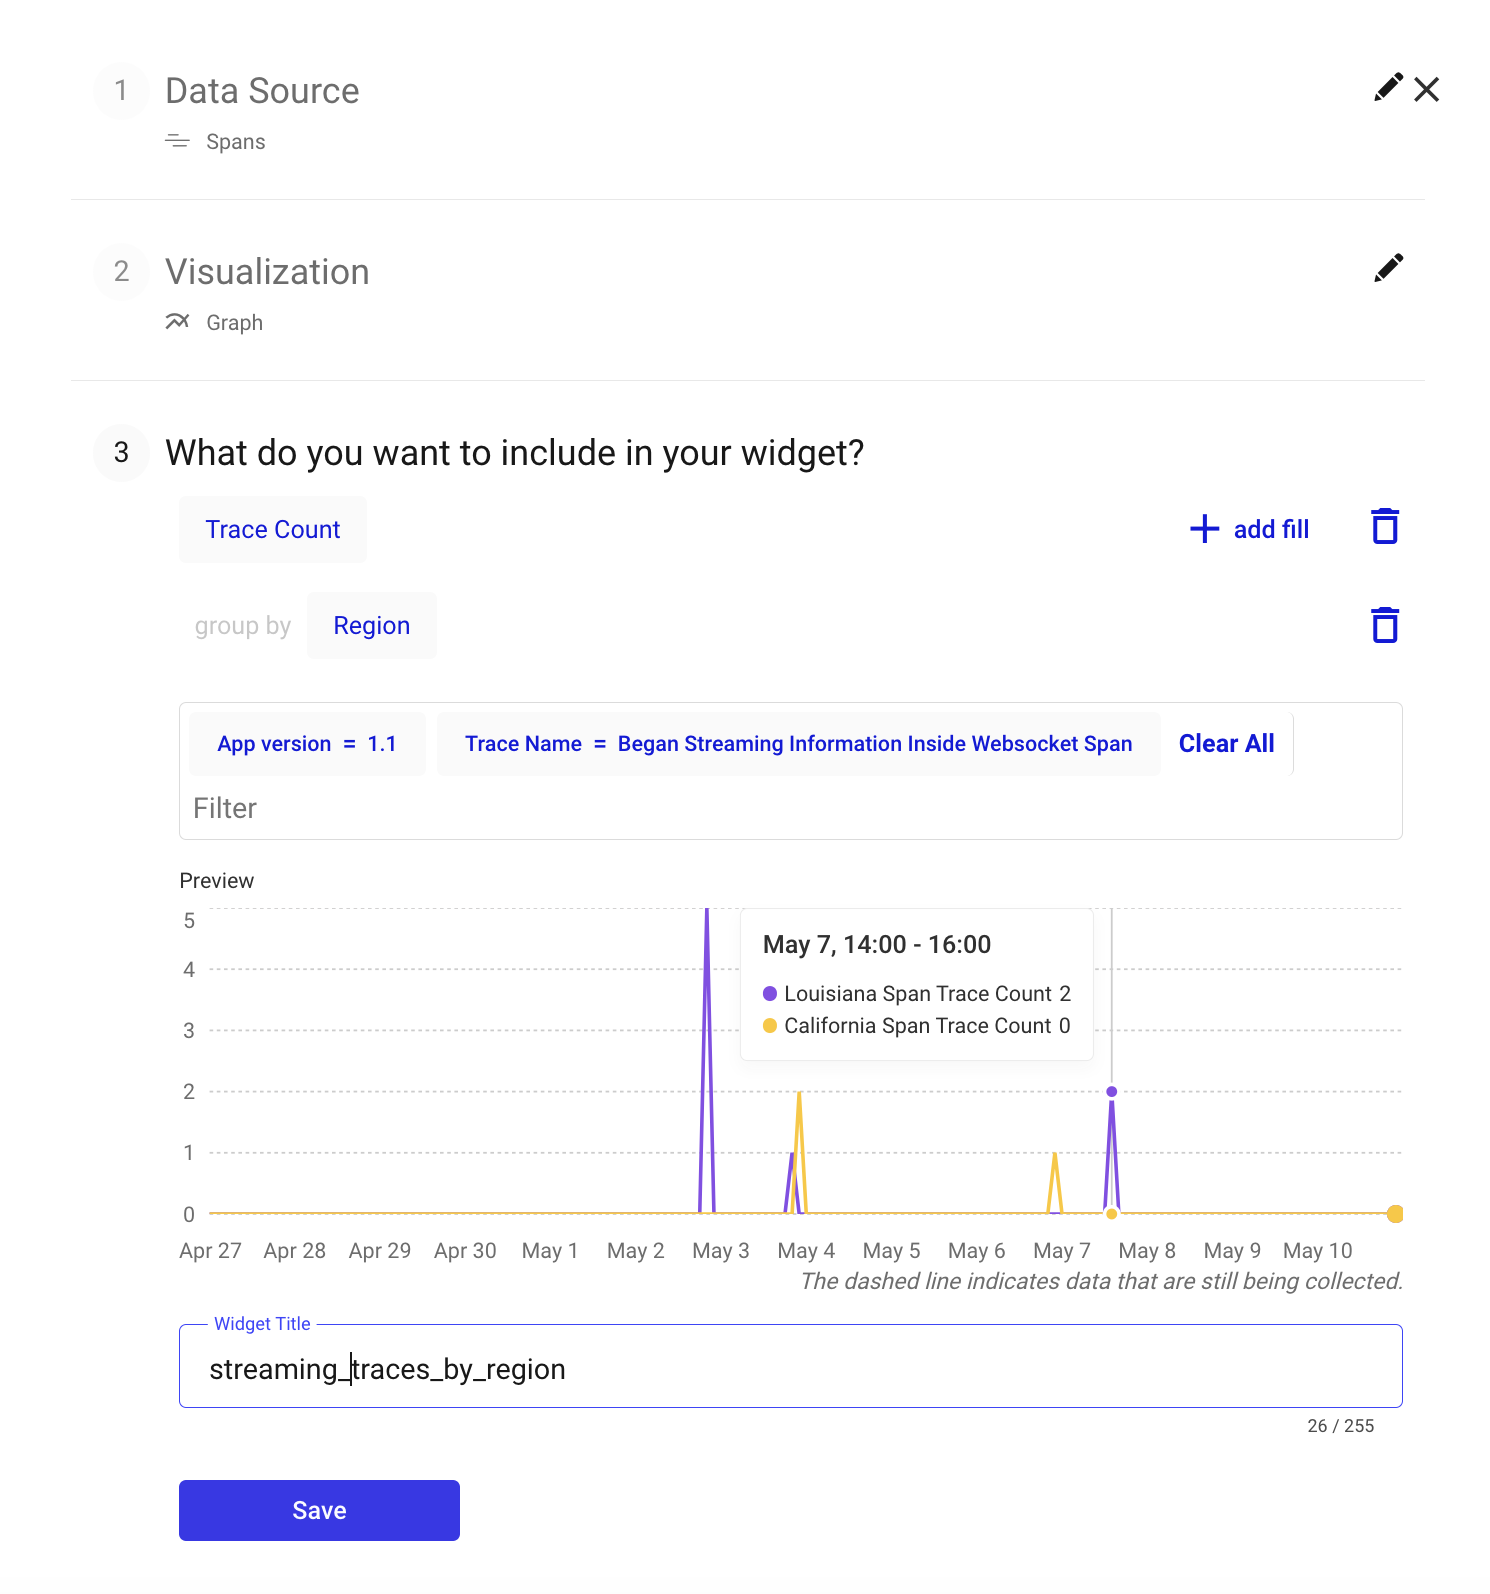
Finally, add any filters and group-bys. In addition to our core dimensions, for Spans you can use the Span's name, outcome, duration, and any custom Attributes.
Combined Time Series
You can also create Combined graphs. With Combined graphs, you can visualize up to 10 time series in the same graph and optionally create a custom time series using arithmetic operators.
Adding Formulas to Graphs
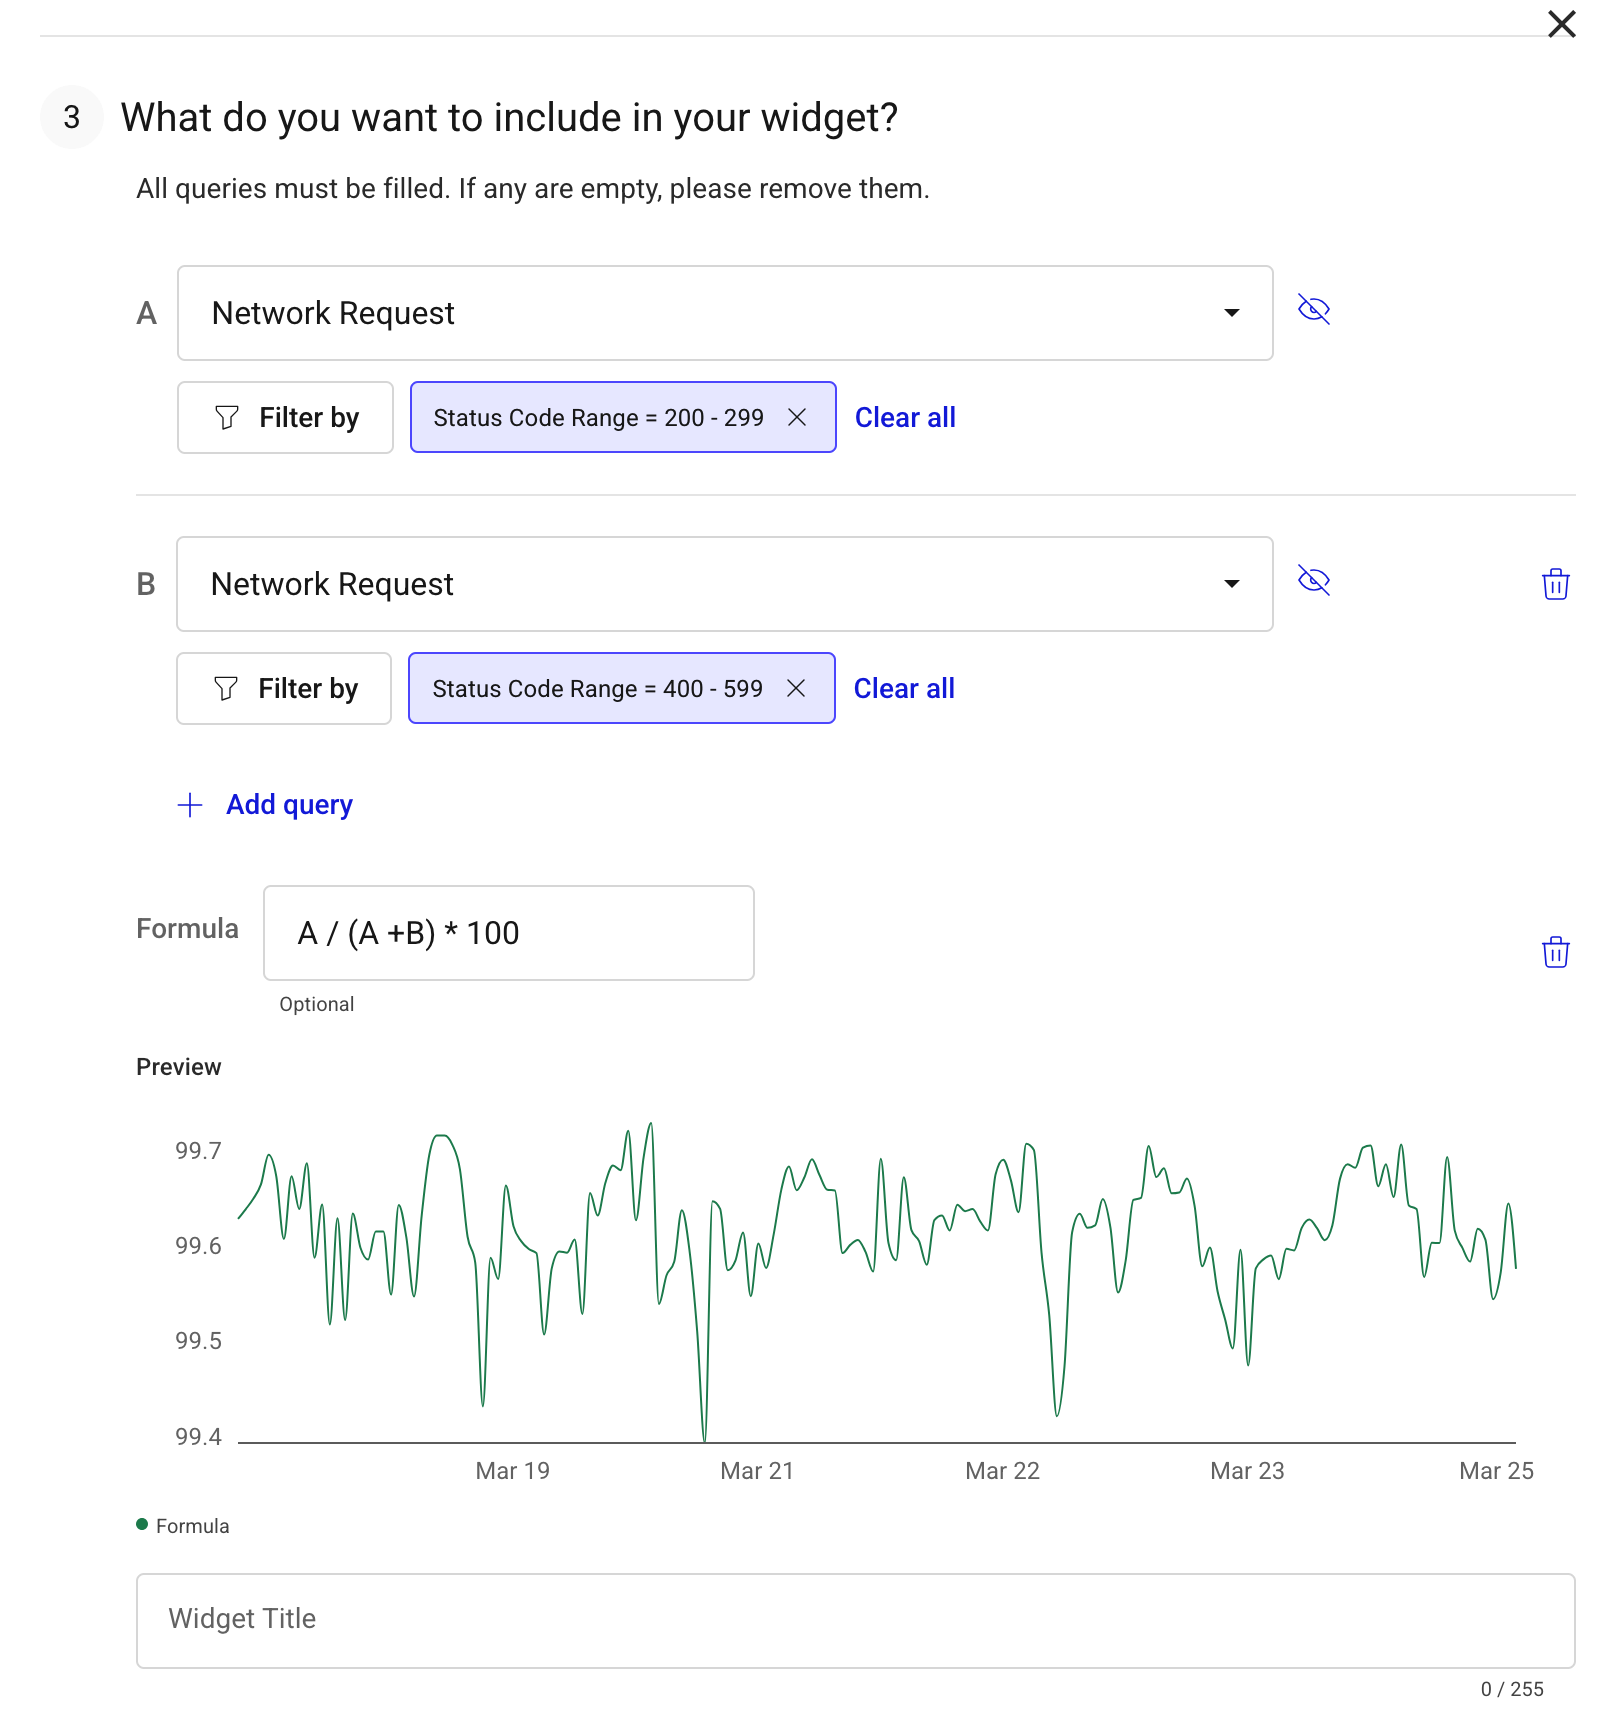
For example, if you want to create a rate of successful network requests but not include redirects. To do this, you will:
- Select the Combined data type from the picker.
- Line charts are the only available graph type currently, so you'll be directed to the query builder (more visualization options coming soon).
- Create 2 queries for Network Request, the first filtered for Status Codes in the range 200-299, and the second in the range 400-599.
- In the Formula box, add the formula
A/(A+B) * 100to get a percentage.
a. The formula field accepts the operators:+, -, *, /.
b. Order of operations follows standard PEMDAS. - Hide the queries above by clicking on the eye symbols to just show the formula, which is your rate.
Note: Queries in Combined type charts do not support group-bys.
Multiple Combined Time Series without a Formula
Since the Formula field is optional, you can visualize up to 10 time series on the same chart with the steps above. Use the eye symbols to show or hide each and leave the Formula field blank.
Table of Issues
Our Issues Widget, lets you specify how to list a table of Issues . You can filter for certain Issue types, add filters to limit app-versions, or select just Issues tagged to your team.
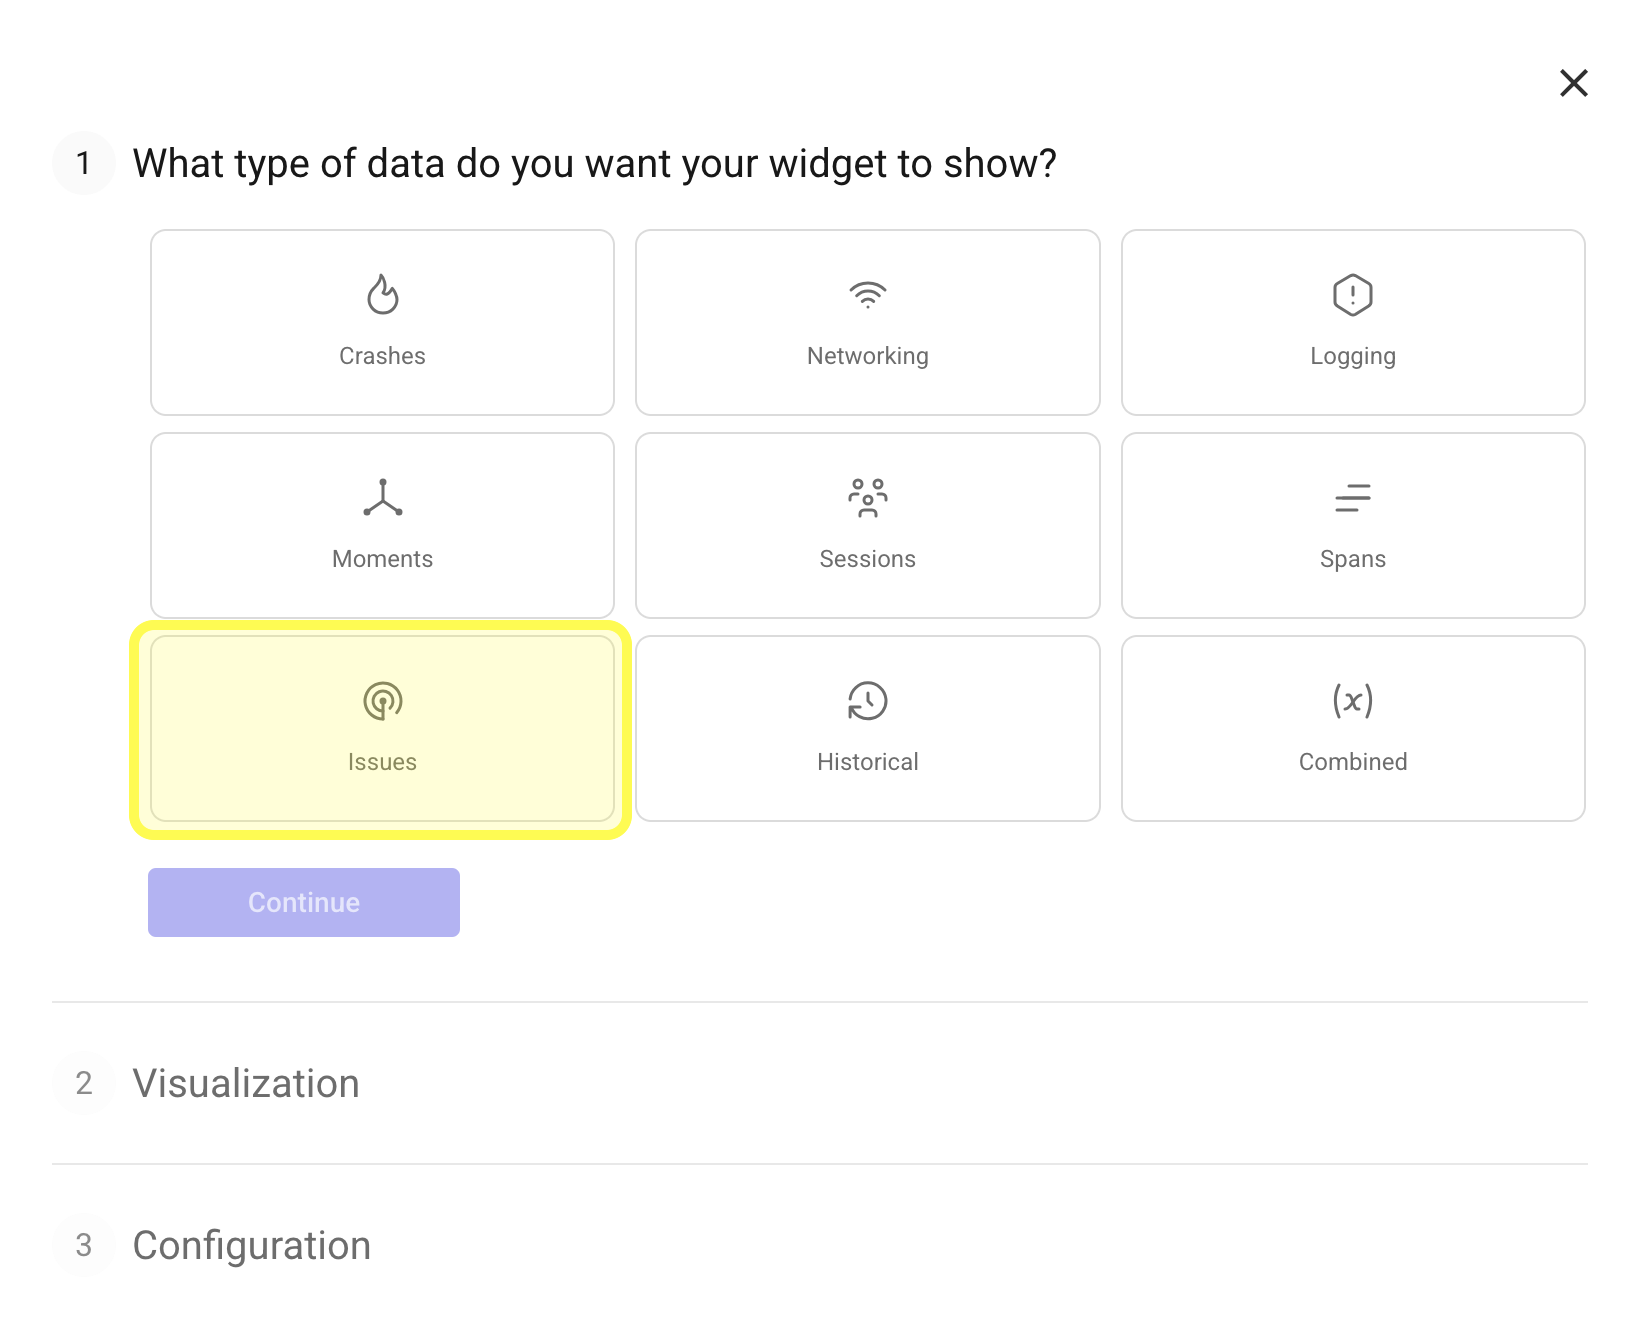
To get started, click on the Issues category when making a new Widget:
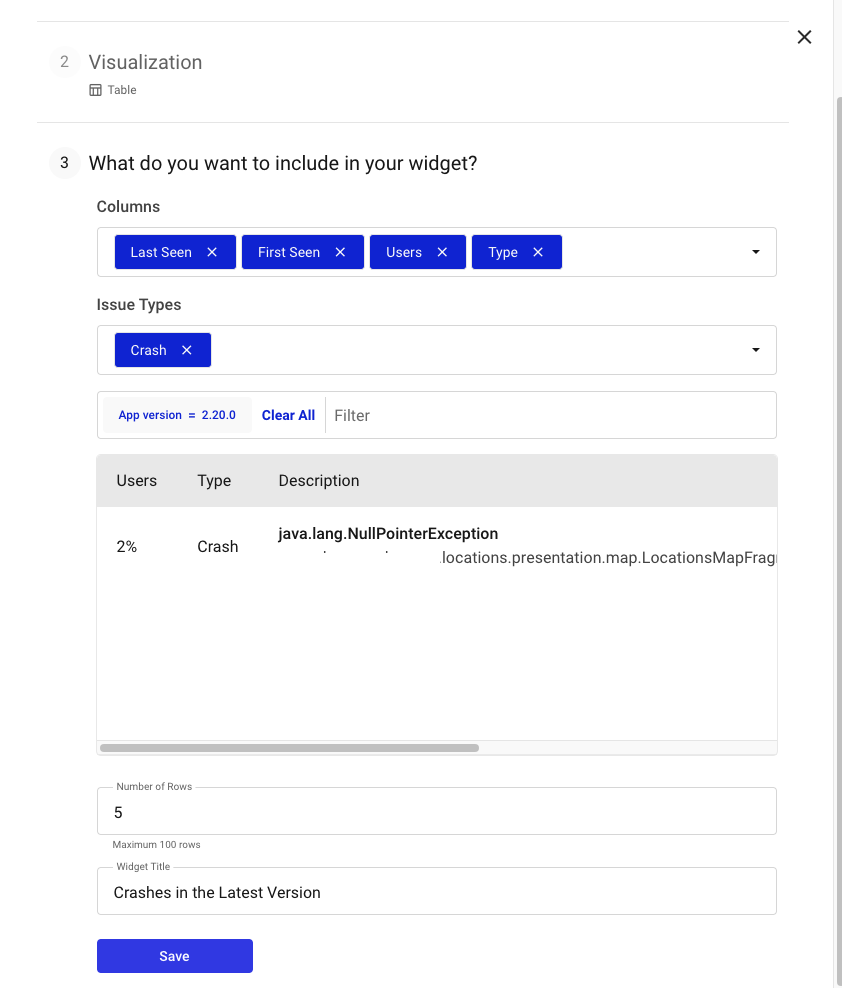
Adjust the columns you want to display and how to filter the Issues
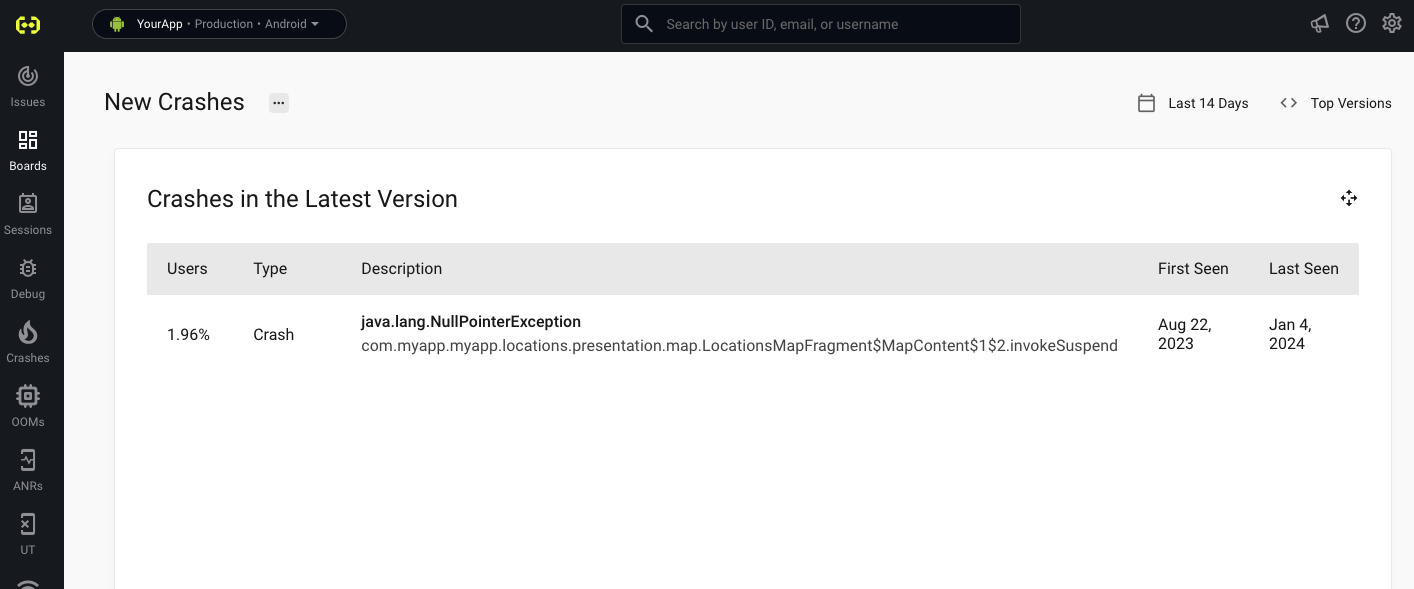
Then once you save, you'll see this table on your dashboard! Issues are sorted by percentage of users impacted:
Emailing Custom Dashboards
You can also email your Custom Dashboards to yourself or your team.
Click on the "Create Report" button in the top right of your dashboard.
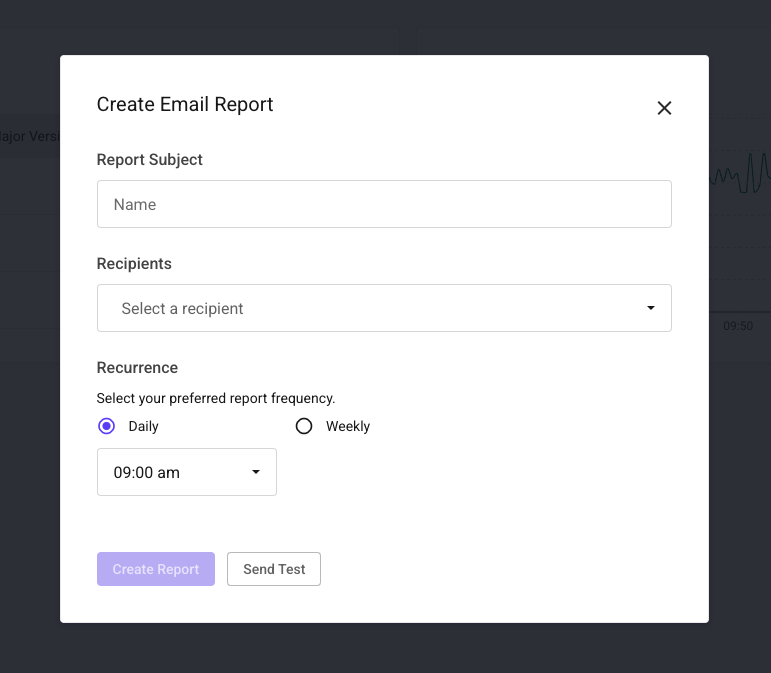
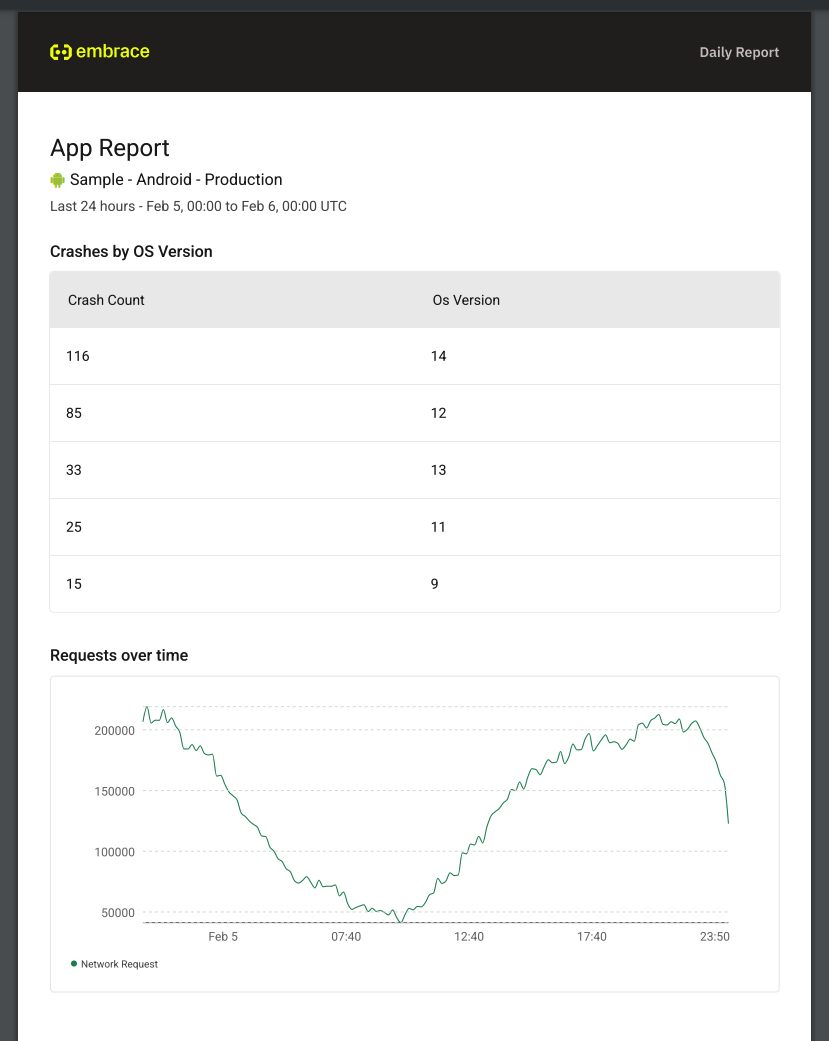
You can set a title for your report, add the recipients, and set the frequency of the report. Frequency options include daily and weekly. You can also set the time of day you'd like to receive the report. You can update any of these options after the report is created.
Before sending the report, you can send a test email to the recipients to ensure the report looks as expected. After a few minutes you should receive the test email.
Grouping by Exploded Properties
You can group your widgets by exploded properties—these are properties that can contain multiple values which we automatically "explode" so each value can be analyzed individually.
This is especially useful if you’re tagging Sessions, Logs, Spans or other events with multiple values and want to break them out into individual groups.
For example, if a Session has a property like BRANCH=["master", "develop", "main", "staging"], you can group by BRANCH, and each of those values will be treated as its own group.
To group by an exploded property:
- When adding or editing a Widget, go to the Group By section.
- Start typing the name of the property you want to use—exploded properties will appear just like any other attribute.
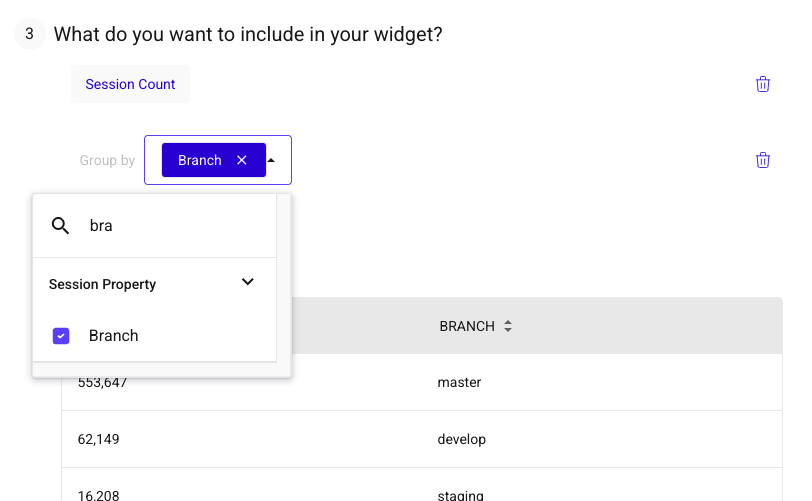
- Select the property. If it's a multi-value field, we'll automatically explode it for you.
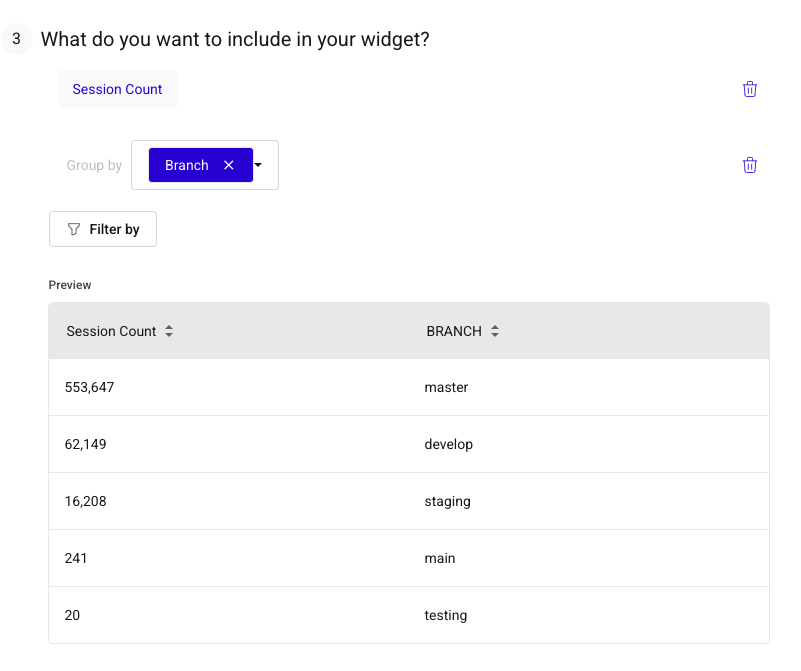
In your results, each unique value will show as its own row or series—allowing you to analyze each individual value separately.