Traces
Embrace’s Traces solution gives you visibility into any app operation you’d like to track, including duration, success rate, and any contextual metadata collected at runtime that helps debug the root cause of your mobile app's performance issues. With our tool, you can quickly spot any bottlenecks in your app’s architecture, pinpoint areas you need to troubleshoot with high precision, and ultimately deliver a truly optimized user experience.
Root Spans View
The primary page shows all root spans in your app, as well as summary metrics like count, error rate, percentiles of duration, and changes from a previous version.
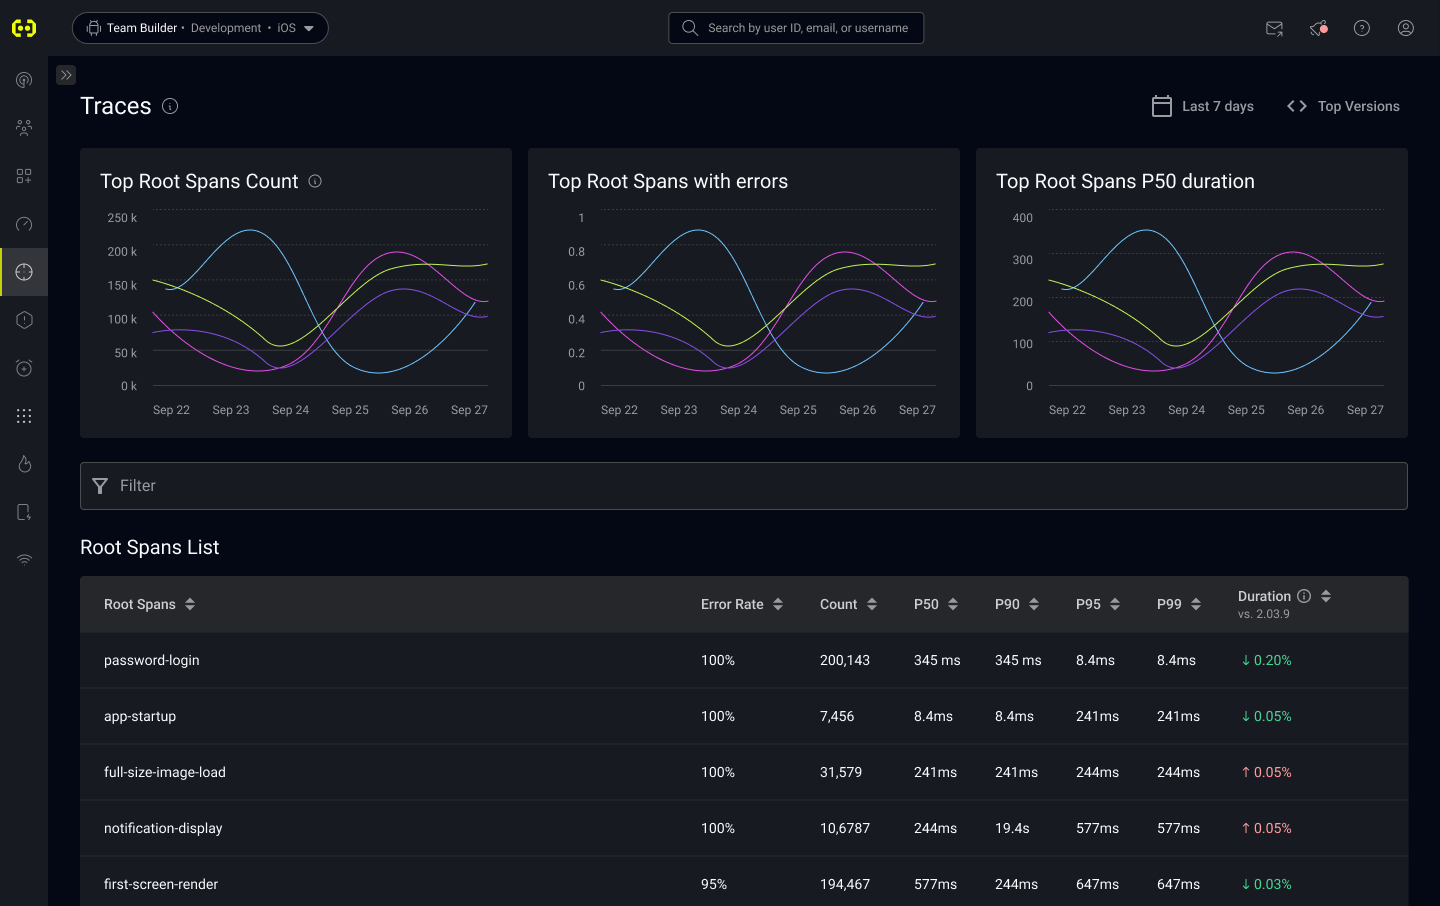
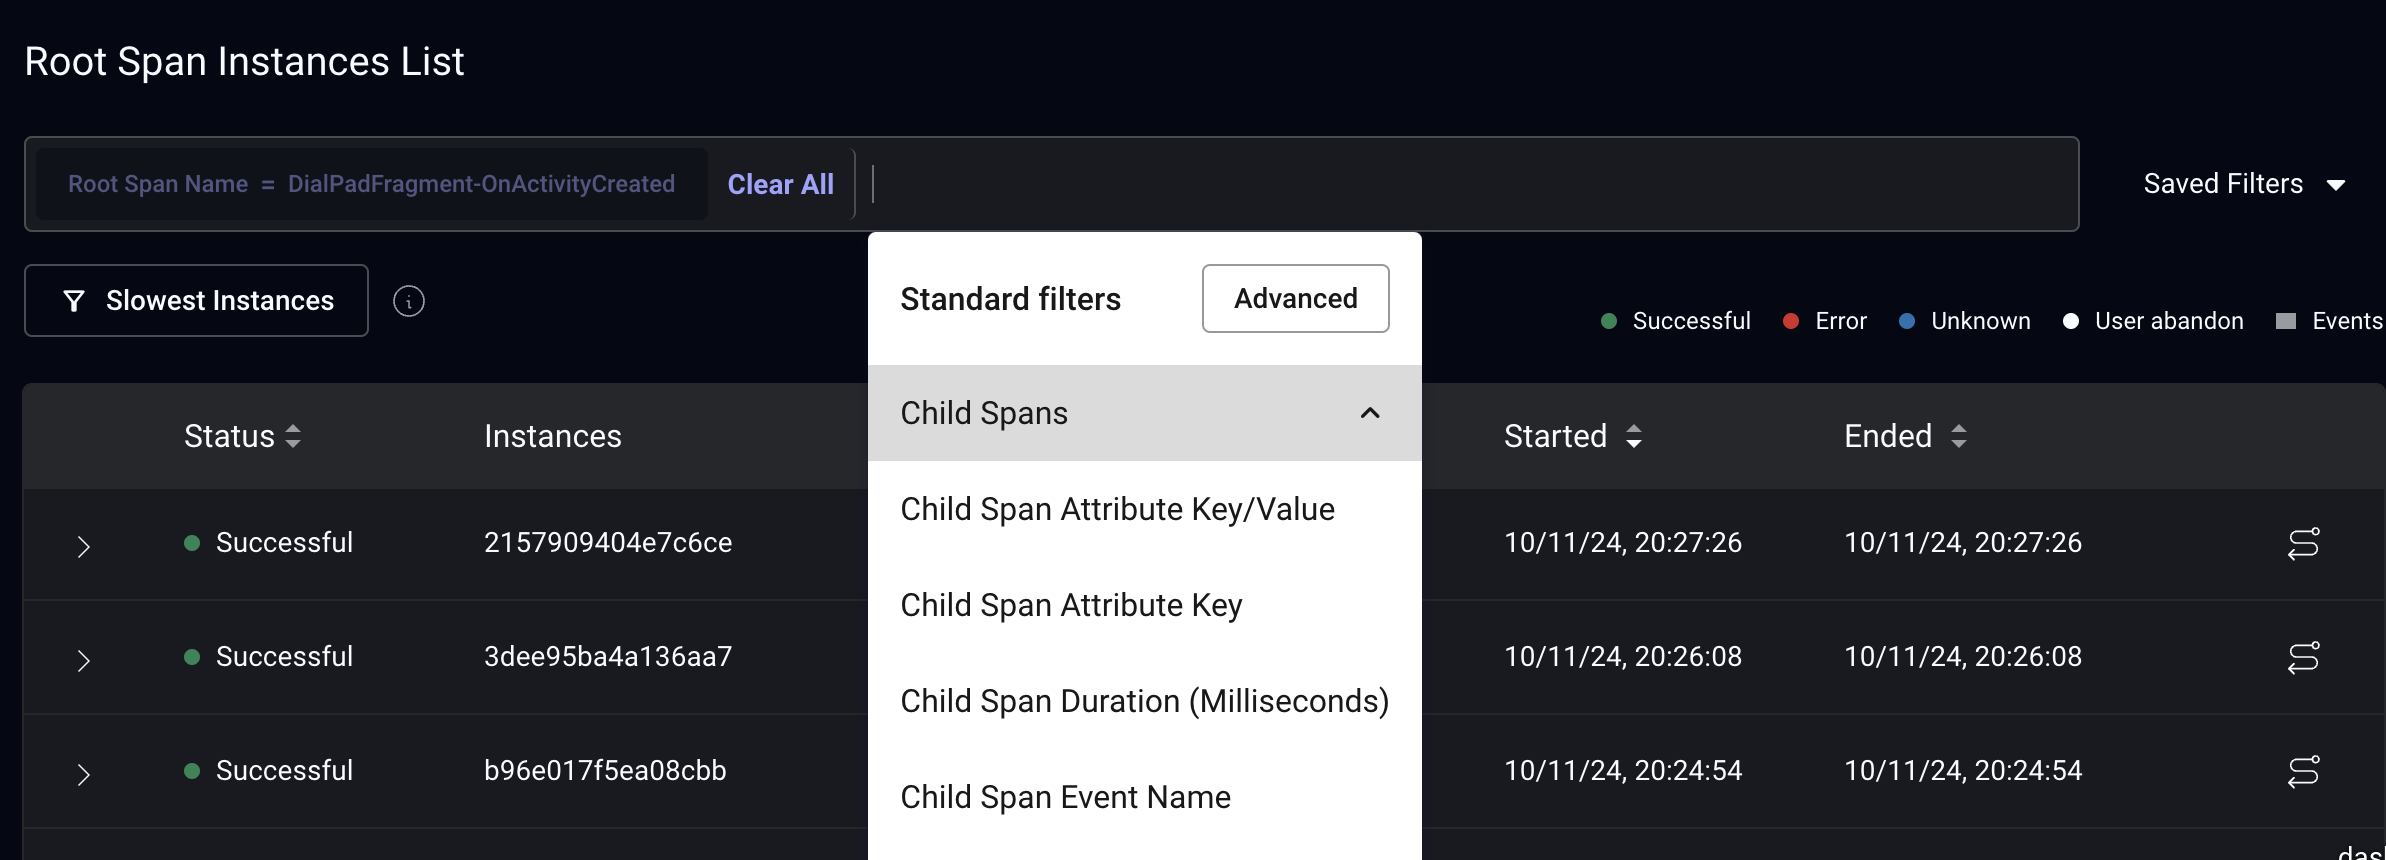
To narrow down the spans that are summarized in this view, you can apply the following filters on the root span as well as the child spans:
- Name
- Duration*
- Outcome
- Attributes keys and values
- Span event names
*failed Spans are not included for duration aggregates, they are displayed as 0
Root Span Summary View
By clicking on the name of a Root Span in the Root Spans View, you can see a partial listing of all the instances of that Root Span.
Each row represents a specific instance of that Root Span being recorded. You can see its status, unique Span ID, and duration, in addition to start and end times. All of these columns other than the Span ID is sortable.
Clicking on the instance will open up an in-line preview of the details of that instance, including the child spans that it has, their duration, and whether they were completed successfully.
On the right side each row that shows a Root Span instance, there are two icons. The first one takes you to the Root Span Instance View, where you can see all the details about that instance, including attributes and events on each child span. The second one takes you to the specific session in the User Timeline view that this instance ended in so you can see the full context of what happened before and after this Root Span was recorded.
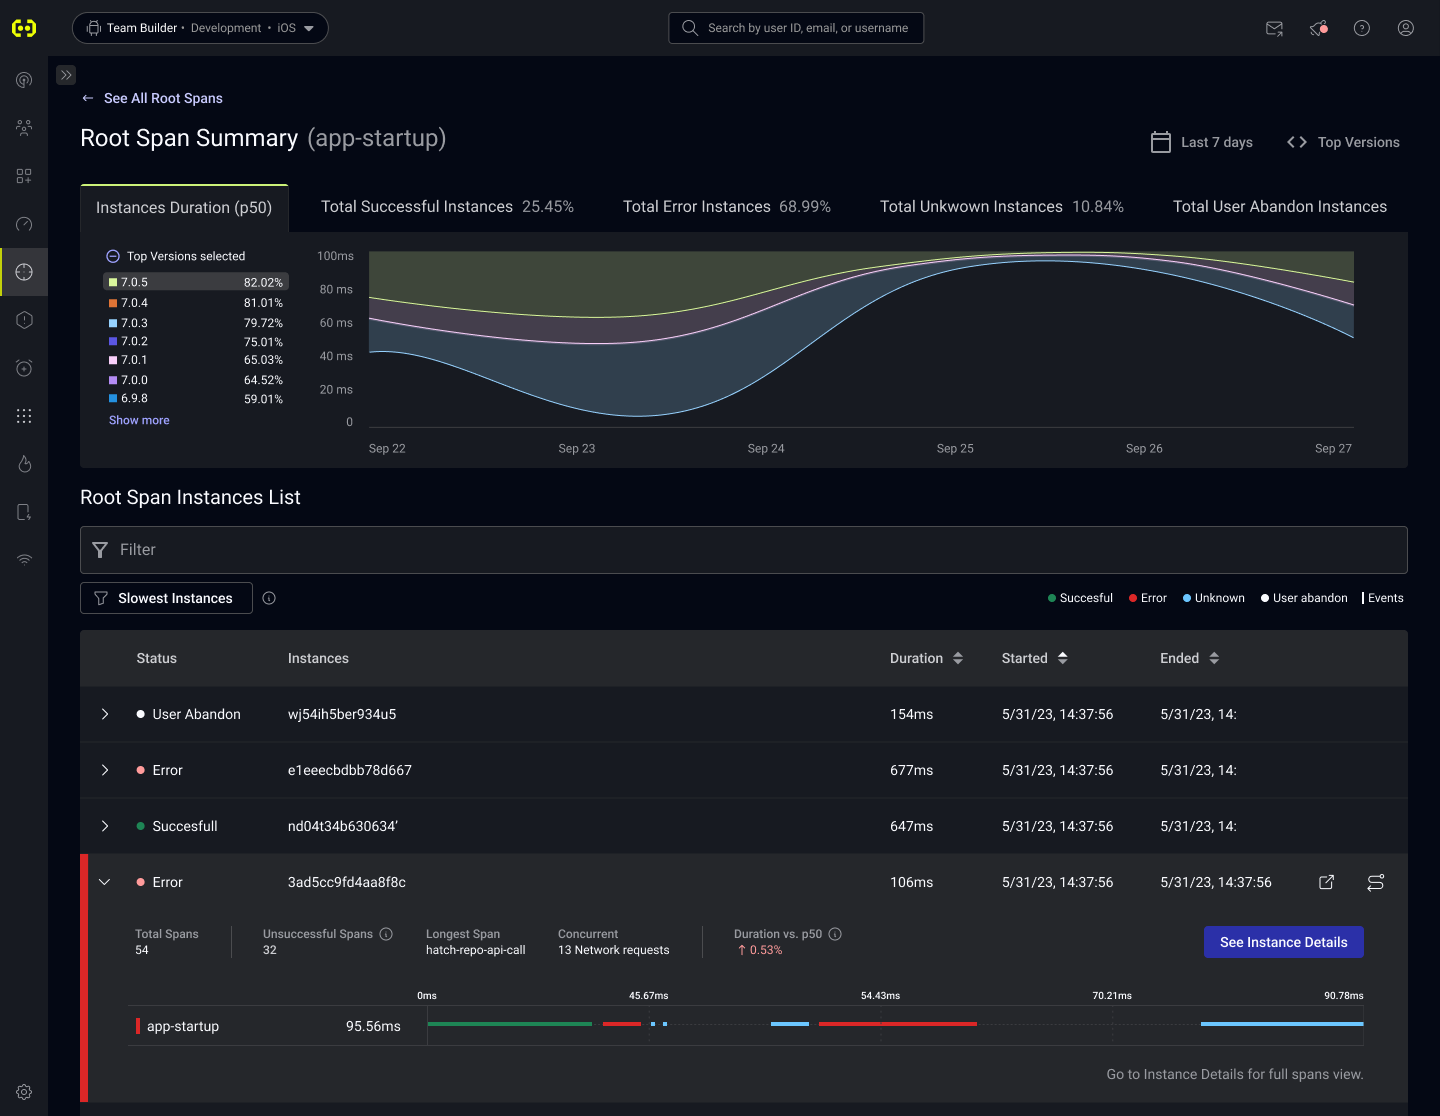
You can filter by properties similar to those in the Root Span View.
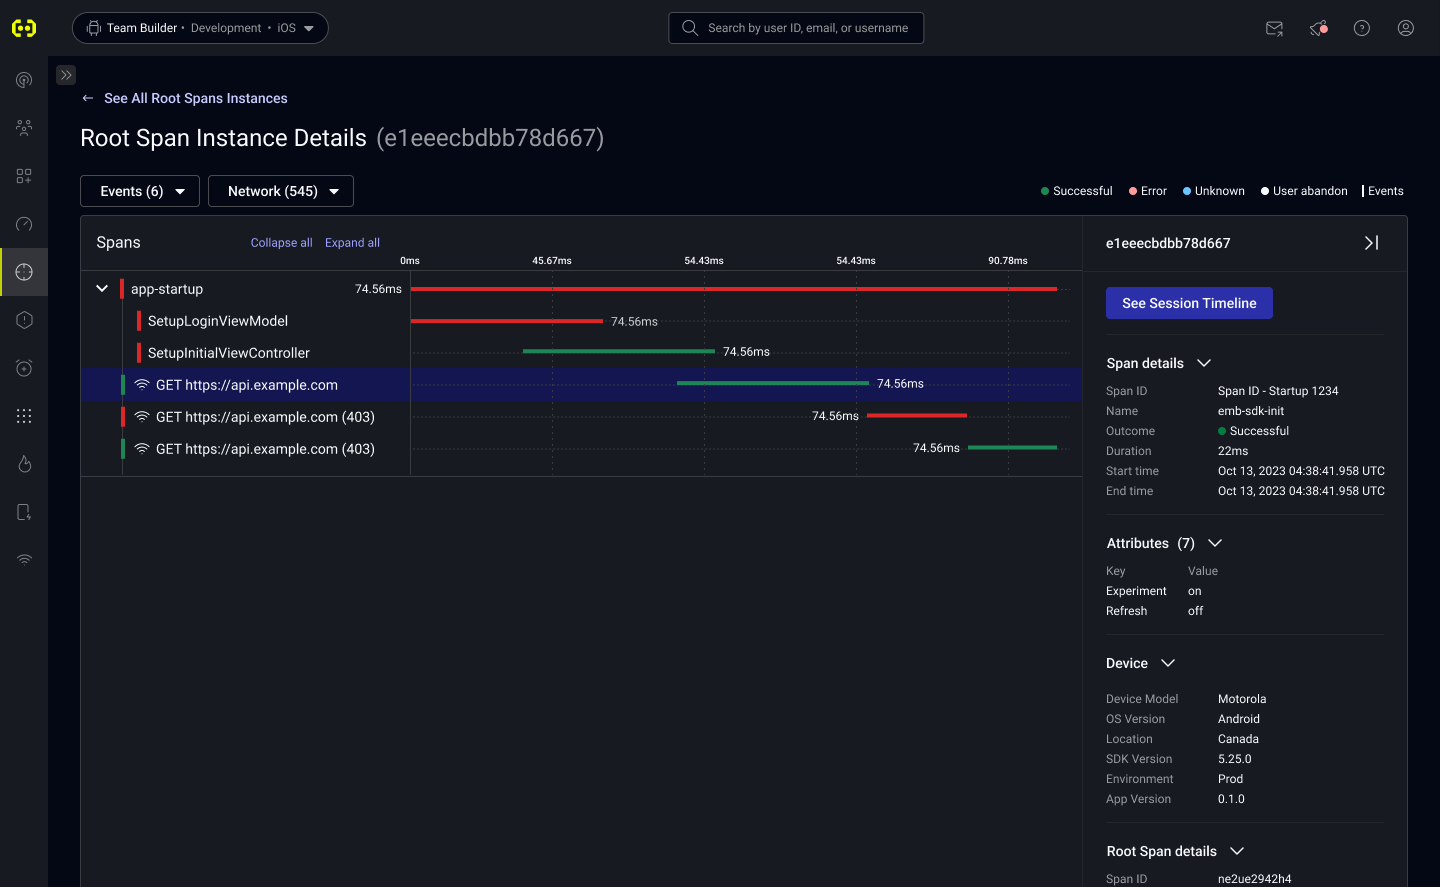
Root Span Instance View
This view shows a Root Span in its entirety. Not only can you see all the information in trace instance preview, you can also see at the individual events and attributes recorded as part of on a each child span, along with metadata about the device and app.
User Timeline view
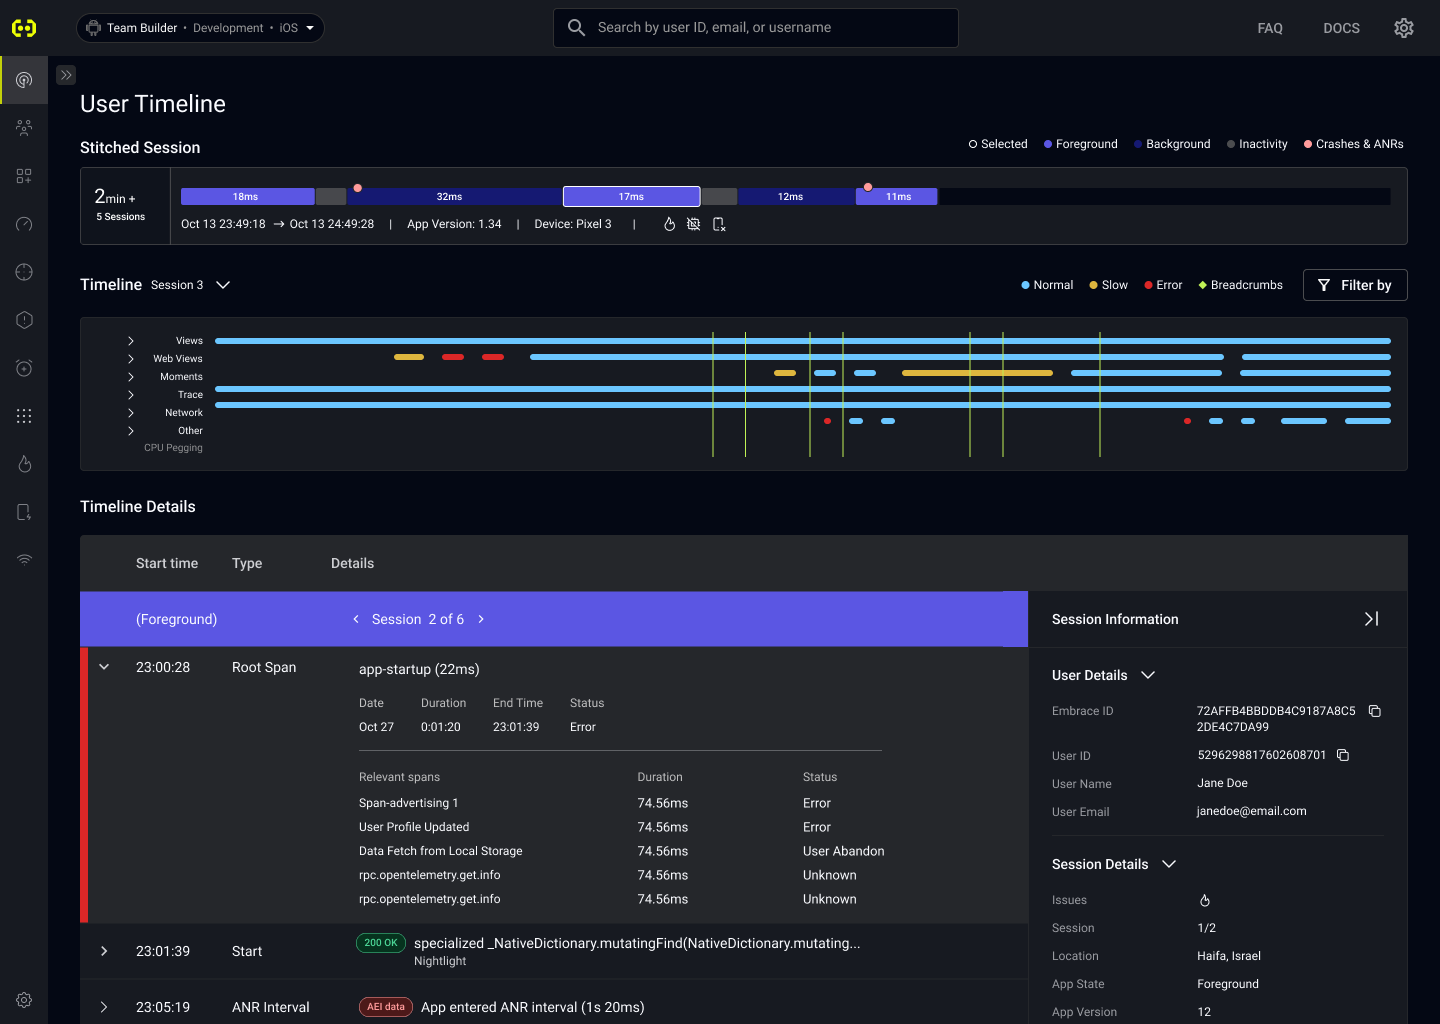
Root Spans appear in both the Timeline View and Timeline Details.
Clicking on "See Details" for any Root Span within the timeline will take you directly to the Root Span Instance View.
Sessions Filters
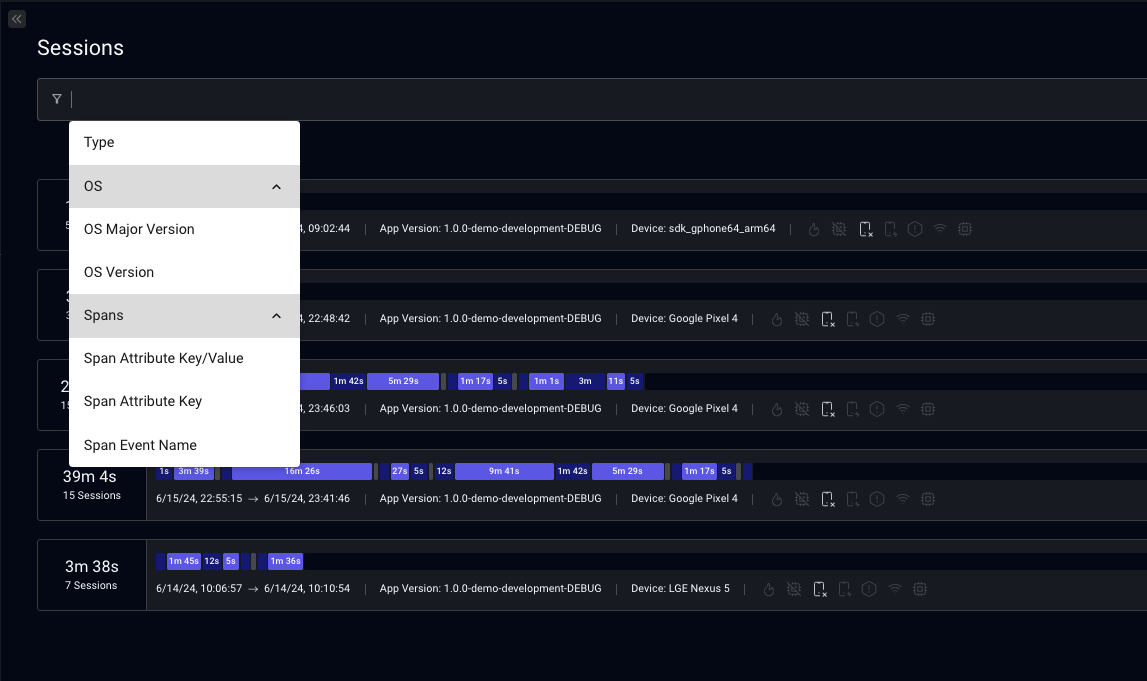
Not only can you filter spans in the various pages dedicated to Traces, you can filter sessions in the Sessions View by whether or not they contain specific spans with certain attributes and events.
Boards, Alerts, and Custom Metrics
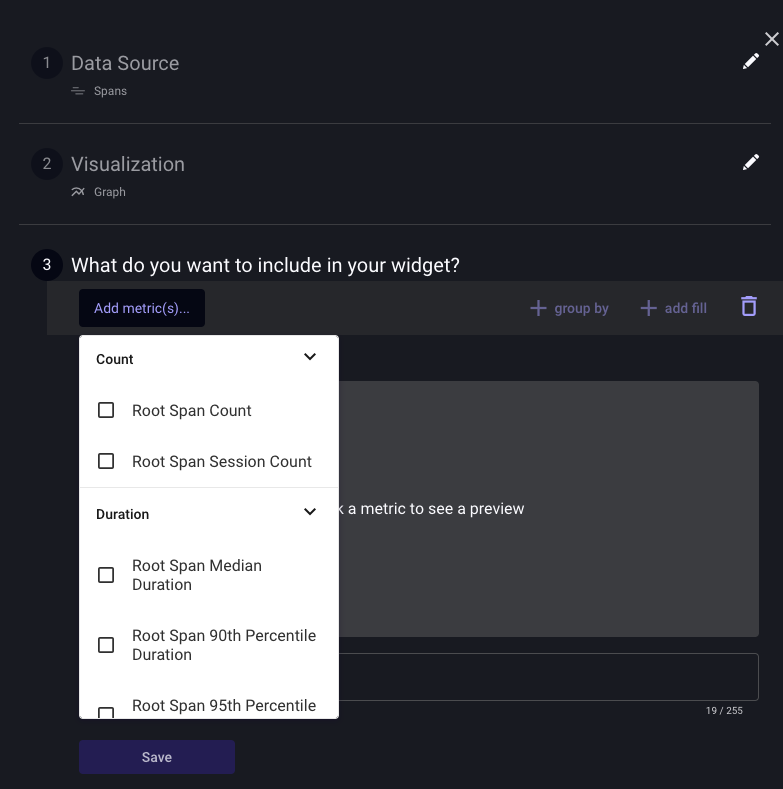
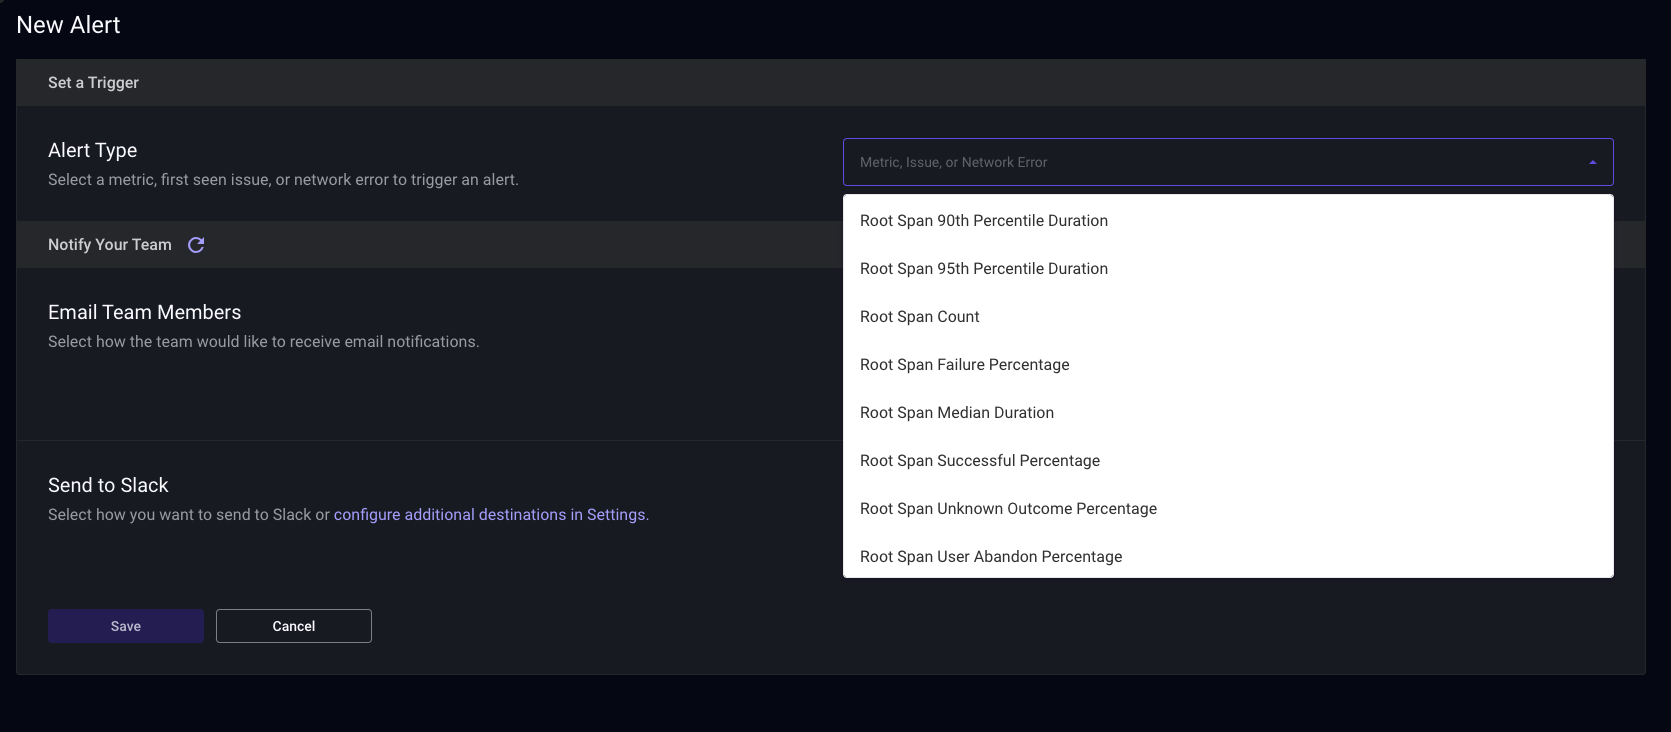
You can create Boards, Alerts, and Custom Metrics based on span data.
Slow Root Spans
With the Slow Root Spans feature, you can identify performance bottlenecks and prioritize your optimization efforts. Slow Root Spans are instances with both significant occurrences (100 over the last two days) and durations surpassing the 95th percentile of successful spans bearing the same name. You can get the slow Root Spans on the issues page.
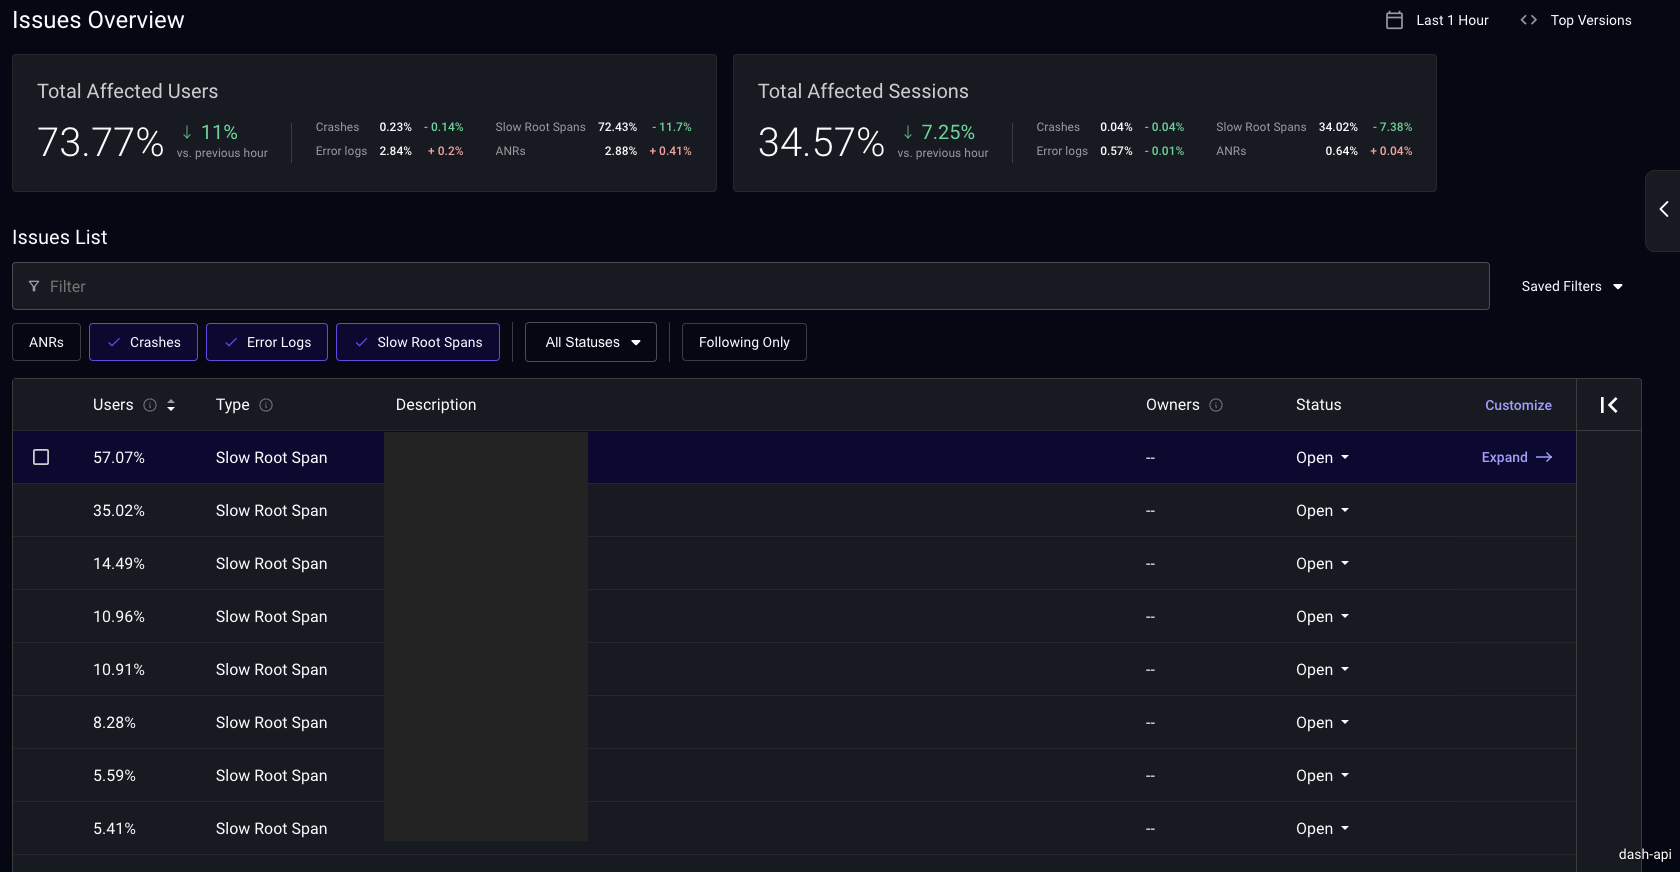
Once you click on a Slow Root Span, you can see specific instances of that span.
Span Instances Filters
Filter your instances by durantion or outcome with these filters:
- All: all instances displayed
- Slowest: instances completed successfully with duration > p95.
- Fastest: instances completed successfully and not slow (with duration < p95).
- Unsuccessful:
- Error: instances encountered an error.
- Unknown: insufficient data to determine instance outcome.
- User Abandon: user navigated away before instance completion.