Supported Metrics
The following metrics are supported. Metrics with the suffix "_total" are gauges.
To query your desired unit, simply prefix the metric name with the unit, eg: daily_crashes_total, hourly_my_custom_sessions_total and five_minute_sessions_total.
Standard
| Metric | Description | Filters | Time granularity |
|---|---|---|---|
| crashes_total | Number of crashes | app_version, os_version, device_model | five_minute, hourly, daily |
| sessions_total | Number of sessions | app_version, os_version, device_model | five_minute, hourly, daily |
| users_total | Number of unique users | app_version, os_version, device_model | daily |
The users_total metric is of type gauge and represents the count of distinct devices utilizing the app within a specific UTC day.
It is important to note that this metric is not designed for cumulative aggregation across days, as doing so would result in double-counting users.
Summing the users metric across various dimensions within the same day does not yield the overall count of unique users per day. This discrepancy arises from the potential overlap of users across different dimensions; for instance, users who update the app version on the same day may be present in multiple dimensions.
Nevertheless, summing the users metric across dimensions can still provide an estimate of the total user counts.
Deprecated metrics after 2023-10-17:
We have deprecated the following metrics in favor of the new metrics mentioned above. All the information provided by these metrics can now be obtained using the new metrics (refer to the Sample Queries section below). These deprecated metrics will remain available for retrieving historical data prior to October 30, 2023. However, we strongly recommend transitioning to the new metrics to ensure a consistent experience.
| Metric | Description | Filters | Time granularity |
|---|---|---|---|
| crash_free_session_by_device_rate_deprecated | Percentage of crash free sessions grouped by device model | app_version, device_model, os_version | hourly, daily |
| crash_session_pct_deprecated | Percentage of crash sessions | app_version, os_version | hourly, daily |
| crash_free_session_rate_deprecated | Percentage of crash free sessions | app_version, os_version | hourly, daily |
| crashed_users_deprecated | Number of unique users with crashes | app_version, os_version | hourly, daily |
| crashes_total_deprecated | Number of crashes | app_version, os_version | five_minute, hourly, daily |
| sessions_by_device_total_deprecated | Number of sessions grouped by device model | app_version, device_model, os_version | hourly, daily |
| sessions_total_deprecated | Number of sessions | app_version, os_version | five_minute, hourly, daily |
| users_deprecated | Number of unique users | app_version, os_version | hourly, daily |
Custom Metrics
Refer to this documentation to know the supported custom metrics.
Sample PromQL queries
- Sessions grouped by devices for a given app version
sum(daily_sessions_total{app_id="<app ID>", app_version="1.2.3"}) by (device_model)
- Sessions grouped by session property city and session property state for a given app version
sum(daily_sessions_total{app_id="<app ID>", app_version="1.2.3"}) by (city, state)
- Percentage of crash free sessions by devices.
1 - sum(hourly_crashes_total{app_id="$app_id"}) by (device_model) / sum(hourly_sessions_total{app_id="$app_id"}) by (device_model) * 100
- Percentage of crash sessions by devices.
sum(hourly_crashes_total{app_id="$app_id"}) by (device_model) / sum(hourly_sessions_total{app_id="$app_id"}) by (device_model) * 100
Also, you can pull data for one, multiple, or all of your organization's apps in a single query.
- To pull for a single app, include the
app_idin the PromQL filter,
sum(hourly_custom_metric_sessions_total{app_id="a1b2C3"})
- To pull for multiple apps, include a pipe-delimited array in the filter,
sum(hourly_custom_metric_sessions_total{app_id=~"a1b2C3|Z9Y8x7"})
- To pull for all apps, do not include any app ID in the filter,
sum(hourly_custom_metric_sessions_total{})
Dimension reduction - "Other"
To reduce storage costs with various observability platforms (eg Datadog), Embrace Metrics examine high cardinality dimensions for consolidation.
Device Models
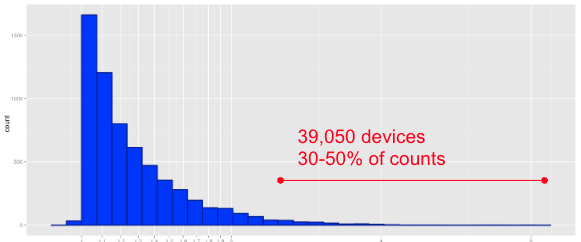
There are over 40,000 unique device models on the Android operating system. The bottom 39,000 models account for ~30% of data typically. Aside from being expensive to store this many unique values, it is also unwieldy to visualize or review!

Currently, we roll together these long-tail device models into an "other" value.
Metrics Availability
This is the time when the metrics will be available to consume in the Embrace Metrics API.
- Five minute metrics will be available to consume in about 4 minutes. Data point calculated at
2024-11-25 00:05:00will be available to consume after2024-11-25 00:10:00. - Hourly metrics will be available to consume in about 15 minutes. Data point calculated at
2024-11-25 01:00:00will be available to consume after2024-11-25 01:14:00. - Daily metrics will be available to consume in about 14 hours. Data point calculated at
2024-11-25 00:00:00will be available to consume after2024-11-25 14:00:00.