Grafana Cloud Integration
Prerequisites
- Have an active Grafana Cloud account.
Configure integration
Pulling your Grafana Cloud API Key or Access Policy / Token
Grafana Cloud migrated from API Keys to Access Policies. It depends on your Grafana Cloud version the information that you need to share with us.
Only Grafana administrators can create or delete API Keys and Access Policies. See Grafana Cloud roles and permissions for more information.
Access Policy/Token
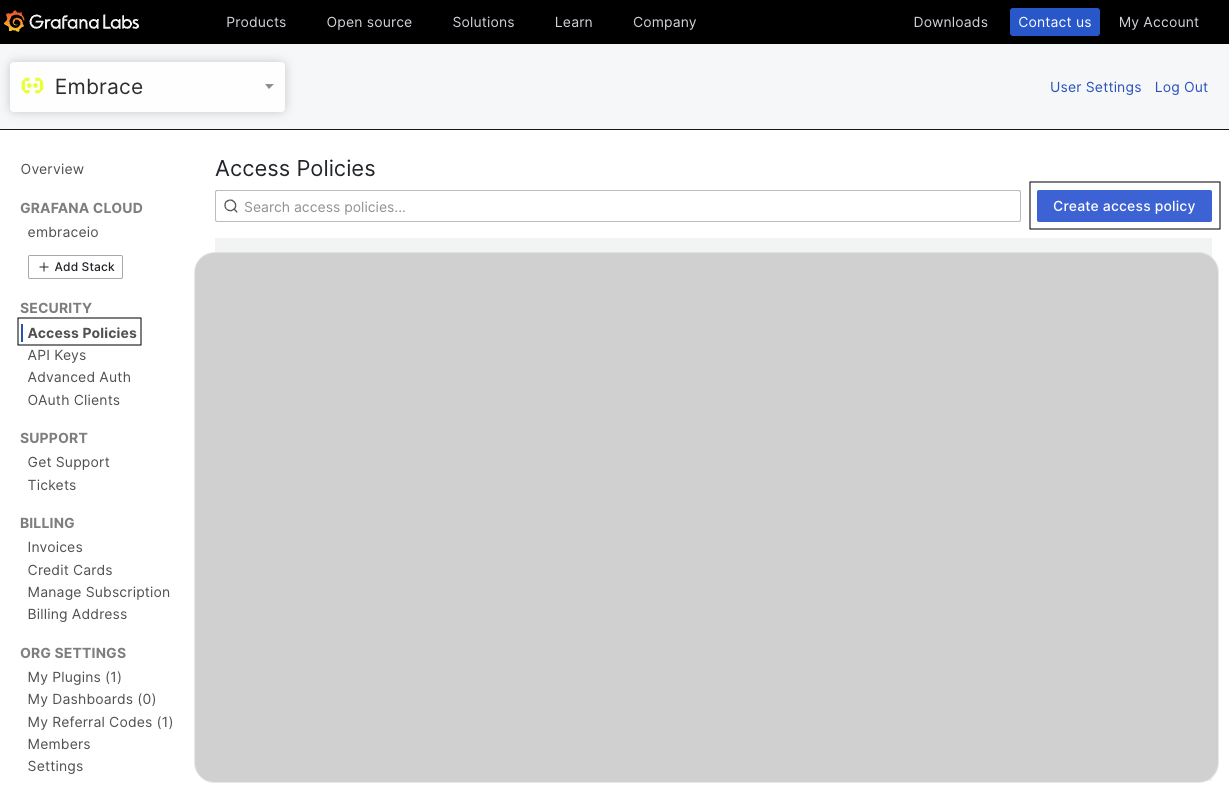
- Log into your Grafana Cloud account to access the Cloud Portal.
- Select the organization that you want to add an Access Policy Token to, by selecting from the dropdown in top left.
- Click Access Policies from the SECURITY section on the left.
- Click Create Access Policy.
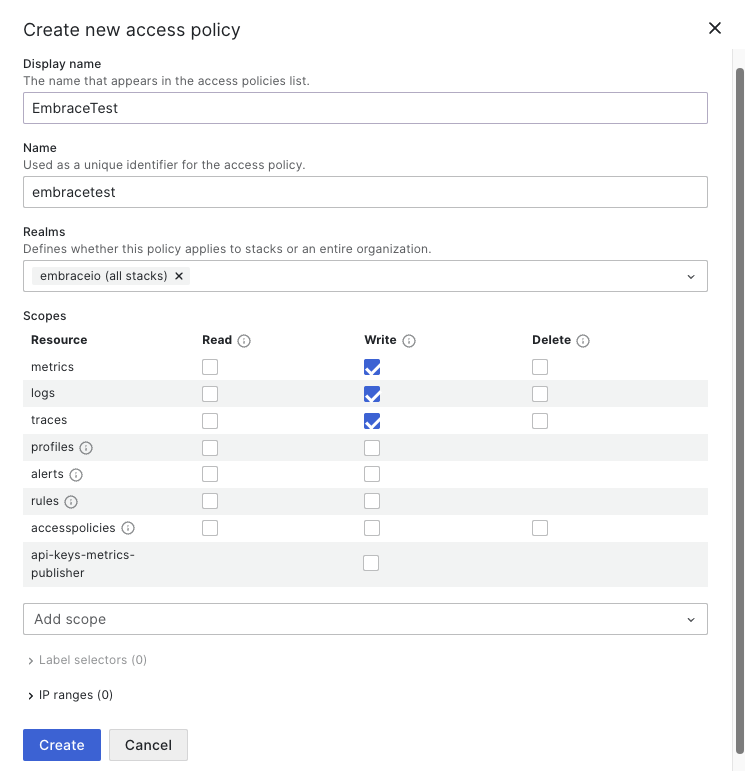
- In Display Name and Name, enter a name for your Access Policy.
- In Realms, choose the organization in which you want the metrics.
- In Scopes, select
writefor Metrics, Logs and Traces. (this only gives permission to send metric, log and trace data to Grafana Cloud). - Click Create when finished.
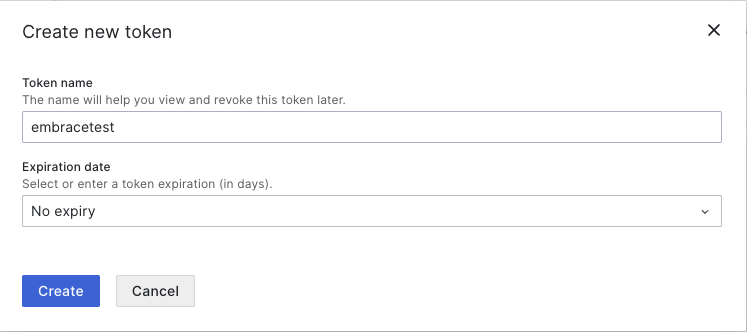
- Click Add token to generate it associated with the access policy.
- In Token Name, enter a name for the token.
- In Expiration Date, select
No expiry.
API Key
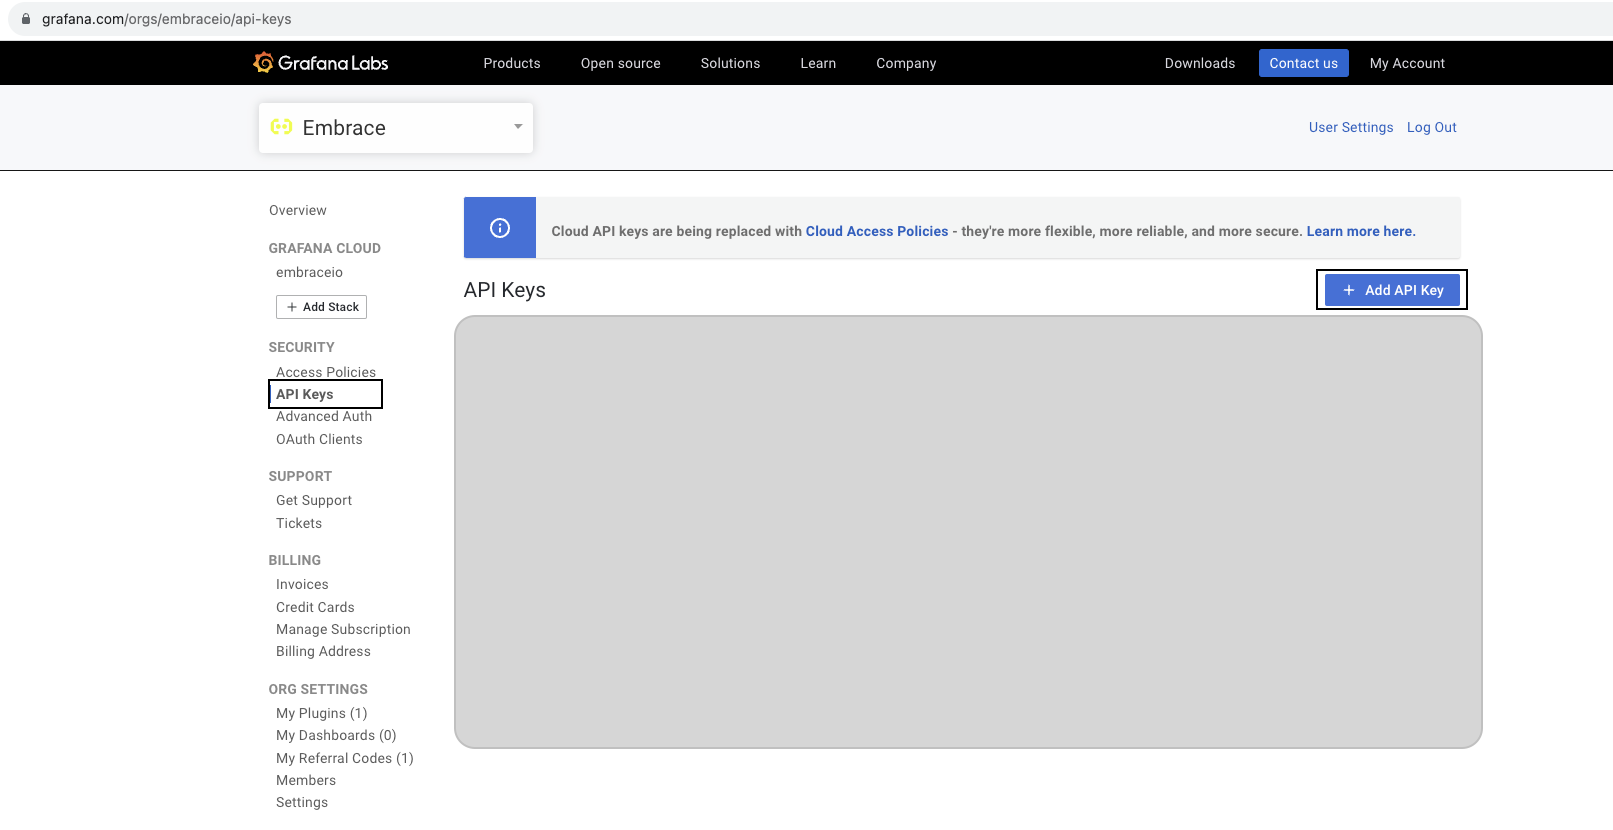
- Log into your Grafana Cloud account to access the Cloud Portal.
- Select the organization that you want to add an API key to, by selecting from the dropdown in top left.
- Click API Keys from the SECURITY section on the left.
- Click +Add API Key.
- In API Key Name, enter a name for your API key.
- In Role, select
MetricsPublisher(is only given permission to send metric, log, and trace data to Grafana Cloud). - Click Create API Key.
- A token is created and displayed. Copy the token and store it in a safe place, because it will not be displayed again.
- Share the token with an Embrace onboarding specialist.
- Click Close when finished.
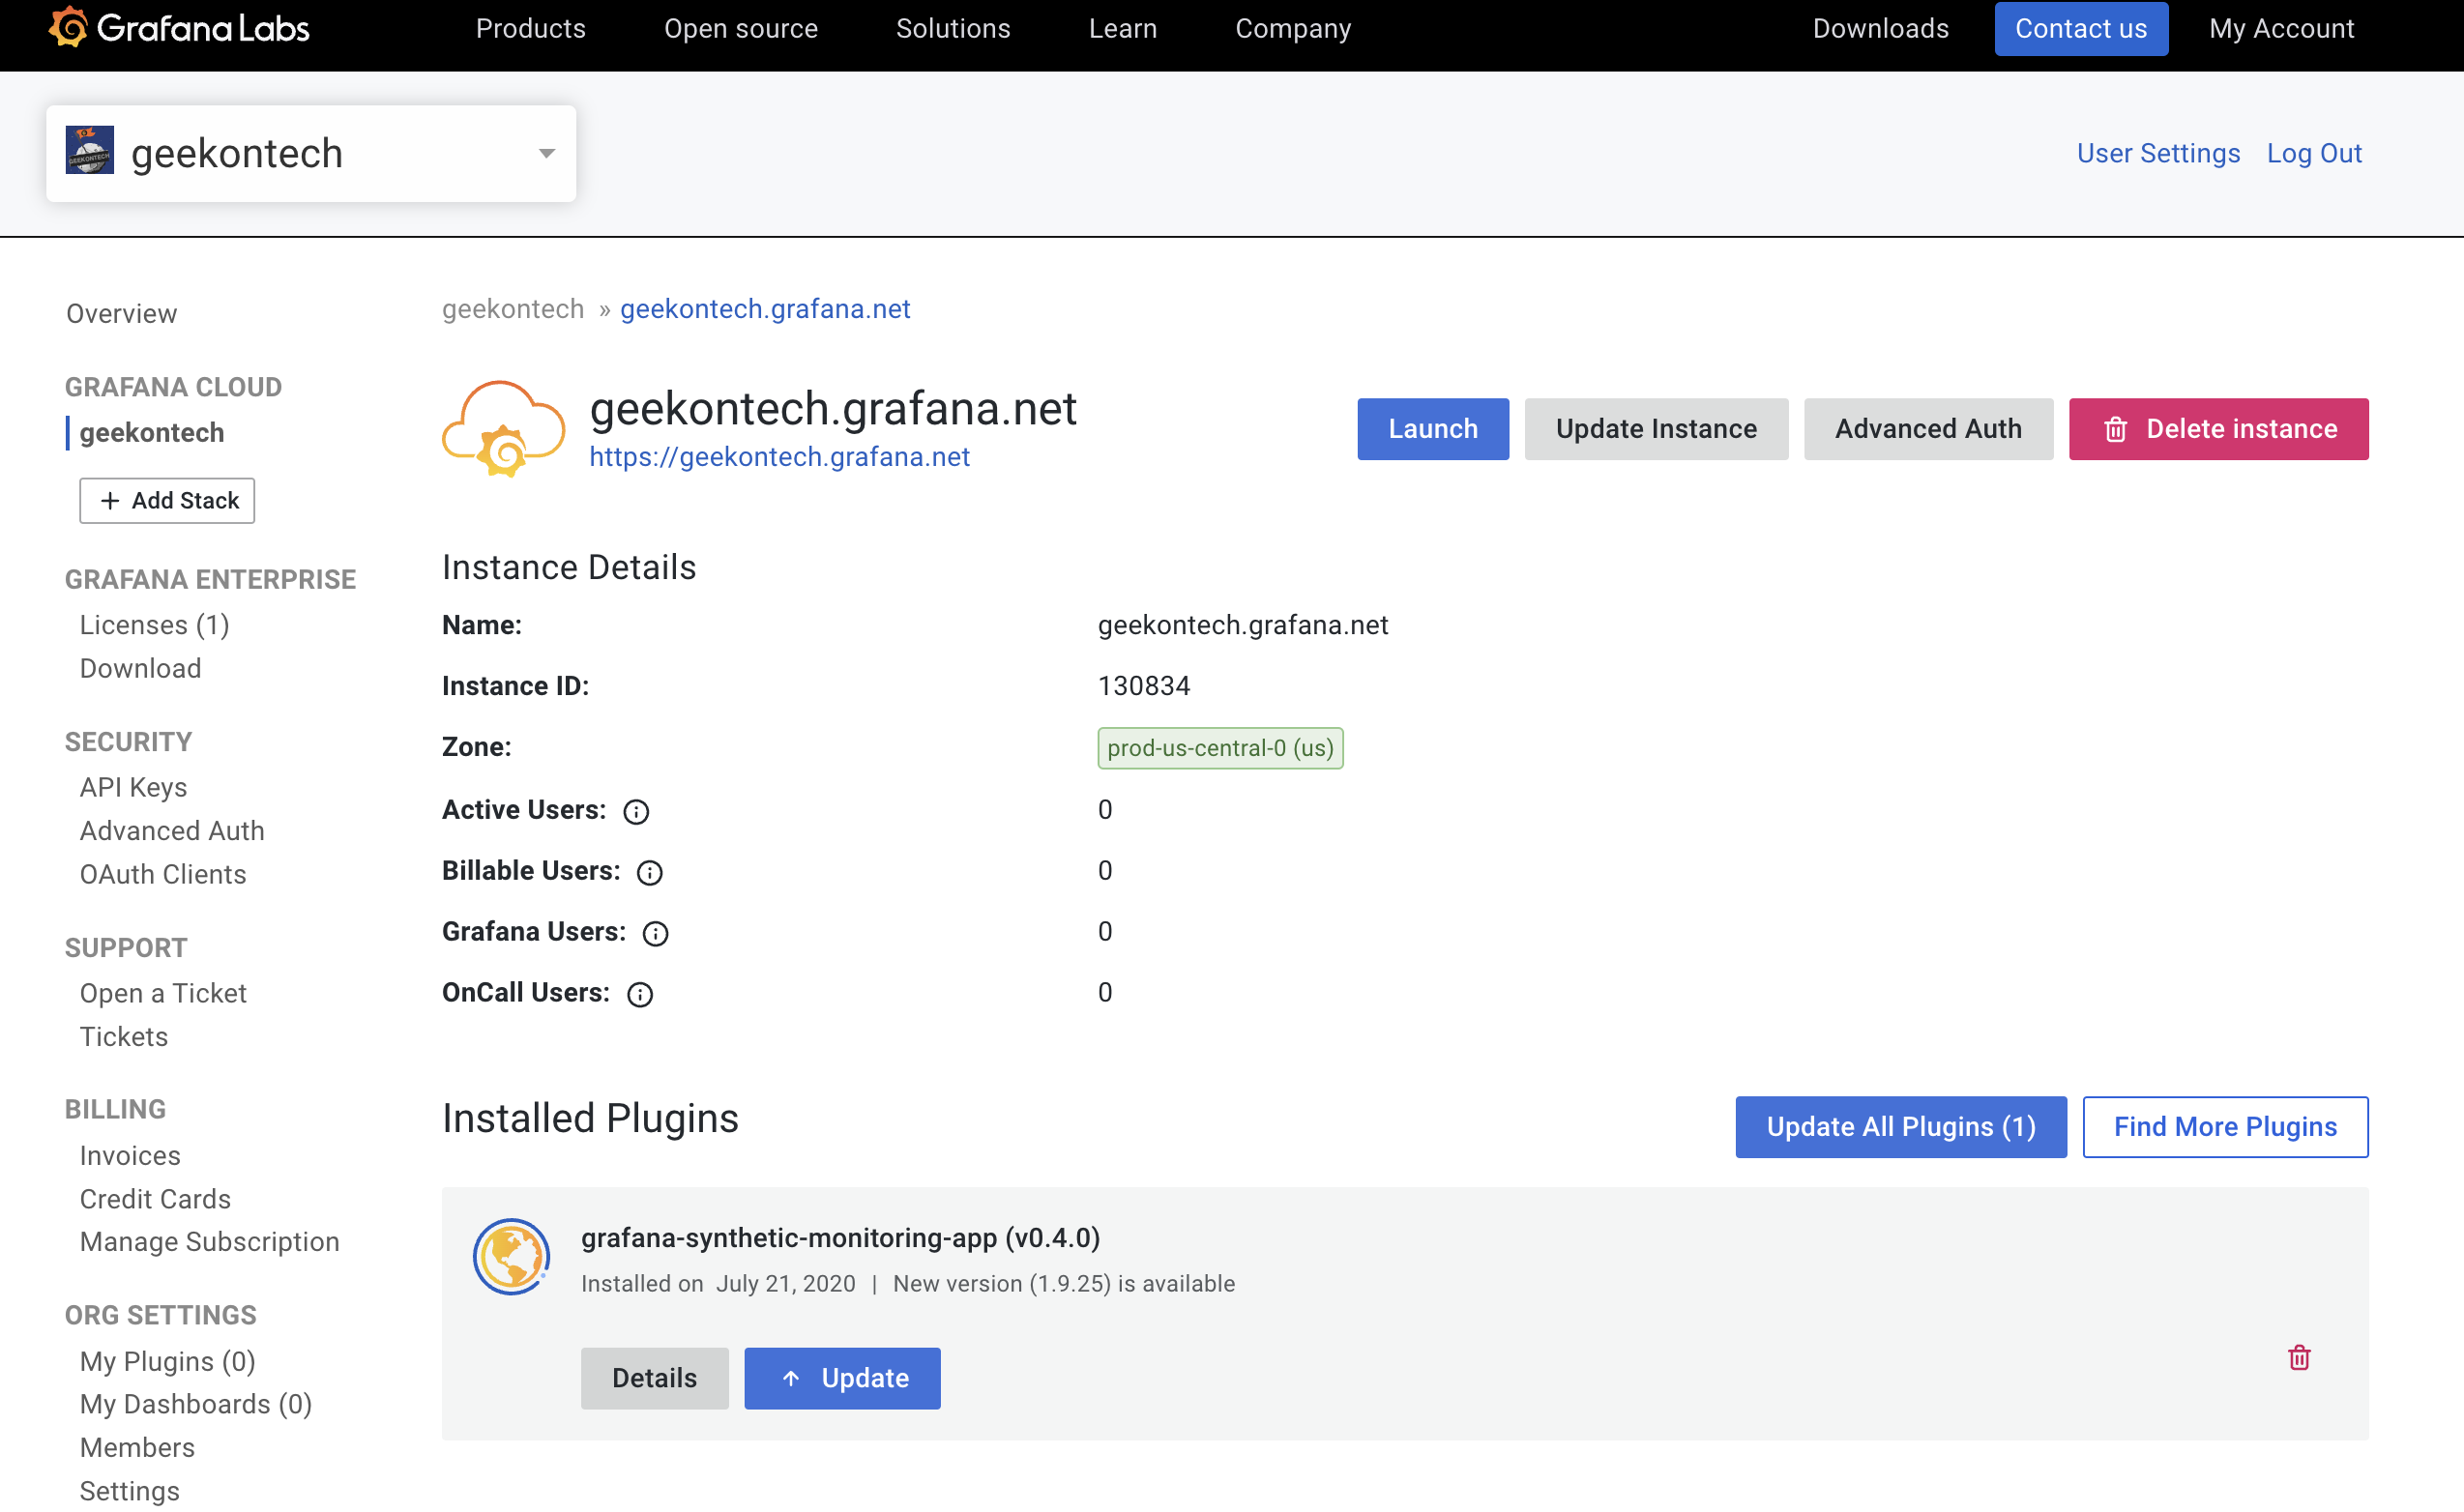
Pulling your Instance ID and Zone
- Log into your Grafana Cloud account to access the Cloud Portal.
- Select the organization you want the instance ID and zone, by selecting from the dropdown in the top left.
- Click Details from the Grafana stack and copy the instance ID and zone.
- Share the instance ID and zone with an Embrace onboarding specialist.
Selecting the correct data source for Embrace Metrics
If you are using the Embrace Metrics API, ensure that you configure Grafana to treat the Embrace Metrics API as a data source, rather than setting up your own Prometheus instance. You can reference this guide.
Embrace provides two main options for viewing metrics within Grafana: using the Embrace Metrics API (pull method) or setting up a Data Destination (push method).
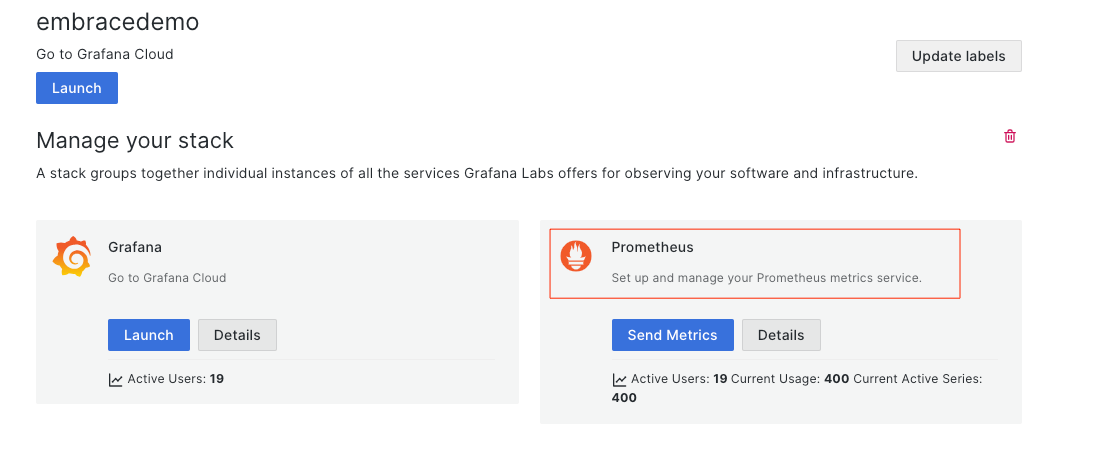
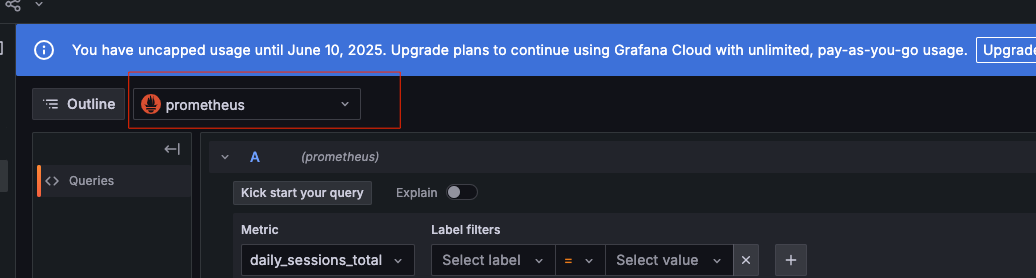
For Data Destination ensure that you are selecting the correct prometheus datasource. Ex:
Embrace Metrics API vs. Data Destination
-
Embrace Metrics API: Alternatively, you can configure Grafana to pull metrics from Embrace using PromQL queries via the Embrace Metrics API. However, this method requires Grafana to be set up with the Embrace Metrics API as a data source and is typically only used if you have specific requirements for on-demand metrics retrieval.
-
Data Destination: Embrace can push metrics directly to your Grafana Cloud instance as a data destination. This setup leverages Grafana Cloud's managed Prometheus services, enabling seamless integration without the need for an additional Prometheus instance. This method is ideal for most users who prefer a simple, automated approach to access Embrace metrics within Grafana Cloud.
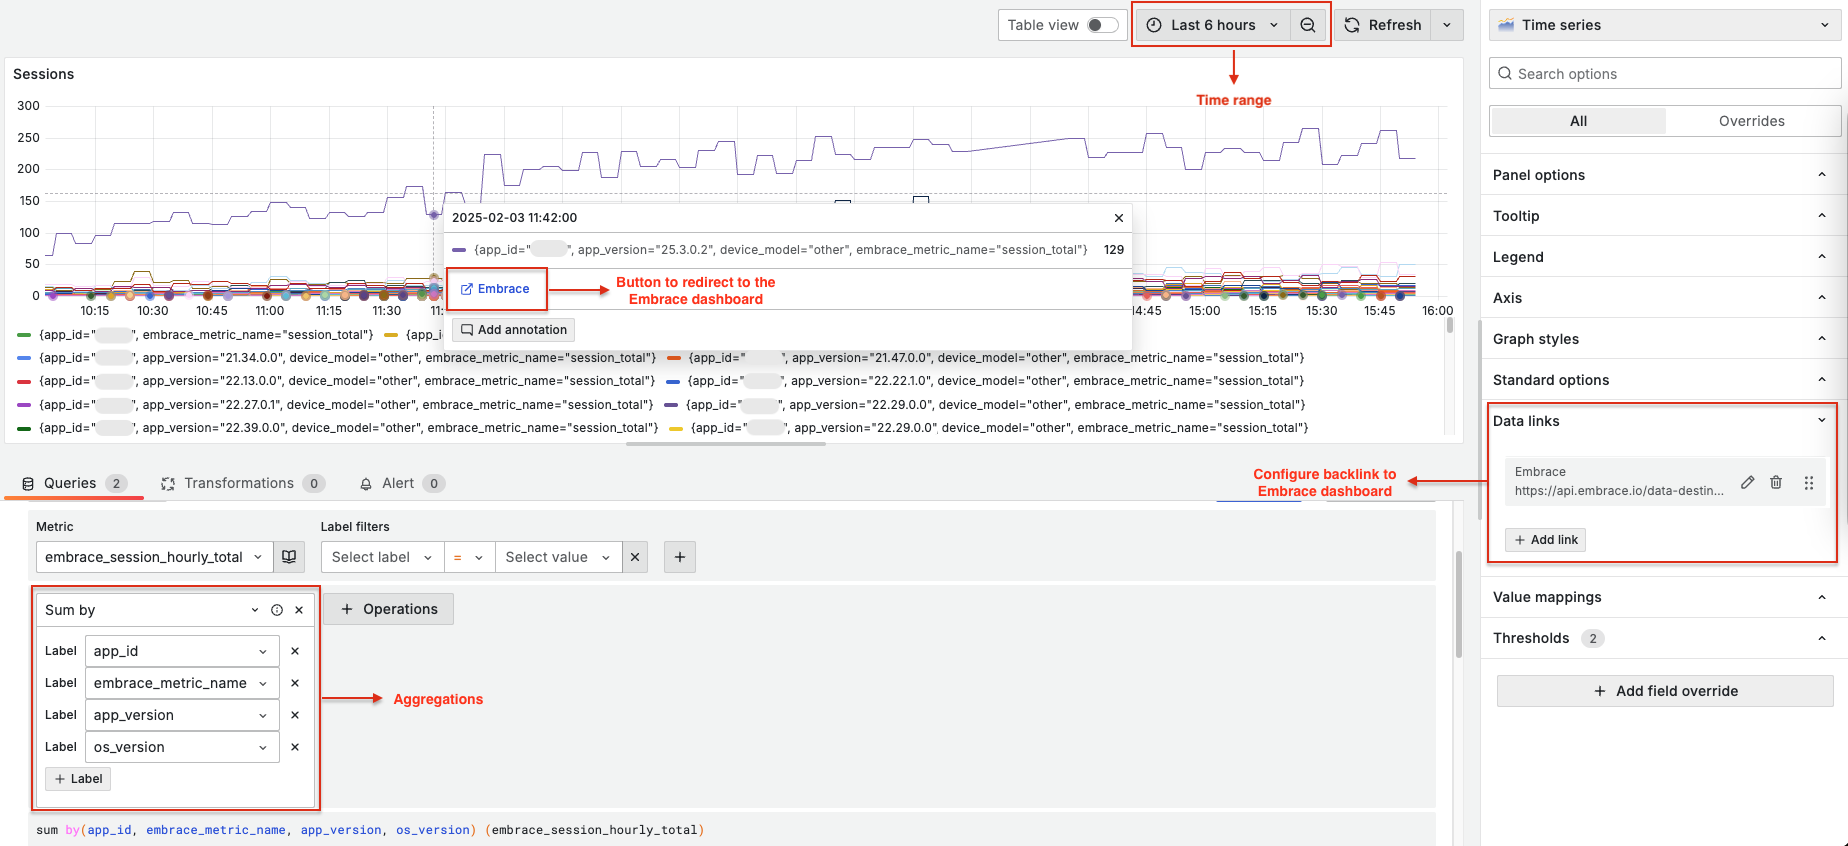
Backlinking from Grafana to Embrace
Embrace offers a backlinking feature that enables customers to seamlessly navigate from Grafana panels visualizing Embrace data to the Embrace dashboard.
The destination within the Embrace dashboard depends on the metric being visualized. For example, if the metric represents session data, the user will be redirected to the Sessions page.
This functionality is powered by an API endpoint that can be configured in Grafana visualizations as a "data link", and redirects users to the corresponding Embrace dashboard, preserving the selected time range and aggregations.
Supported Options
Embrace supports a subset of the filters that may be active in the Grafana visualization where the data link is configured. Please note that any unsupported filters will be ignored when following the backlink to the Embrace dashboard.
Supported options:
- Time range. Embrace will use the same time range on the Embrace dashboard. If the time range is specified in relative format (e.g. "Last 12 hours"), it will be converted to absolute time stamps.
- Aggregations. For example, if the metric is aggregated by
os_versionandcountry(e.g.sum by(app_id, country, os_version, embrace_metric_name) (embrace_crash_hourly_total)), Embrace will use those filters with theequaloperator on the Embrace dashboard.
Unsupported options:
- The following aggregations are ignored when Embrace generates the dashboard backlink:
duration_bucket,group_id,log_property_value,moment_property_value,root_span_attribute_value,root_span_duration_bucket,session_property_value,status_code,tag_value.
- Top N aggregations. Embrace converts these since the
othervalue cannot be mapped to a specific value on the Embrace dashboard. Aggregations that are converted:device_modelconverted tomodel_market_name(Model Name).top_n_domainconverted todomain.top_n_market_nameconverted tomodel_market_name(Model Name).top_n_pathconverted topath.
- Label filters. For example, a metric that is filtered by
os_versionandcountry, but these labels are not in the aggregation clause (e.g.sum by(app_id, embrace_metric_name) (embrace_crash_hourly_total{os_version="12", country="US"})). In this case, Embrace is unable to access the filters in the backlink. - Filters that are part of the metric specification. Any filters that were configured when the custom metric is initially configured in the Embrace dashboard are not supported by the backlink. For example, a custom metric
sessions_totalthat is grouped byos_versionand filtered byapp_version = 1.2.3on the Embrace dashboard, and visualized within Grafana assum by (app_id, os_version, embrace_metric_name) (embrace_session_hourly_total)will useos_versionfilter in the backlink, but not theapp_version.
Configuring backlinks
- Go to the Grafana Dashboard where you visualize your Embrace metrics.
- Go to the Grafana Visualization where you want to add the Embrace dashboard backlink.
- Ensure that all Embrace metrics are aggregated by
app_idandembrace_metric_name. Embrace uses those aggregations to generate the Embrace dashboard backlink. Example: this (sum by (os_version) (embrace_session_hourly_total)) doesn't work and this (sum by (os_version, app_id, embrace_metric_name) (embrace_session_hourly_total)) works.
- Ensure that all Embrace metrics are aggregated by
- Hover over the Grafana Visualization to reveal the three dot menu in the top-right and select "edit".
- In the right sidebar menu, scroll down to the "Data Links" section. Click the "+ Add link" button, and enter the following details:
- Title: Embrace.
- URL:
https://api.embrace.io/data-destinations/api/v1/grafana_cloud/dashboard-backlink?labels=${__field.labels}&from=${__from}&to=${__to} - Open in new tab:
on.